ESTERO, Fla., July 1, 2019 /PRNewswire/ — Hertz Global Holdings, Inc. (NYSE: HTZ) announced today that it plans to report its second quarter 2019 financial results after market close on Tuesday, August 6 and will host its accompanying webcast and conference call to discuss such results on Wednesday, August 7 at 8:30 a.m. ET.
This webcast and conference call can be accessed through a link on the Investor Relations section of the Hertz website, ir.hertz.com, or by dialing (800) 230-1059 and providing passcode 469574. Investors are encouraged to dial-in approximately 10 minutes prior to the call. A web replay will remain available for approximately one year. A telephone replay will be available one hour following the conclusion of the call for one year at (800) 475-6701 with pass code 469574.
ABOUT HERTZ
The Hertz Corporation, a subsidiary of Hertz Global Holdings, Inc., operates the Hertz, Dollar and Thrifty vehicle rental brands in approximately 10,200 corporate and franchisee locations throughout North America, Europe, the Caribbean, Latin America, Africa, the Middle East, Asia, Australia and New Zealand. The Hertz Corporation is one of the largest worldwide vehicle rental companies, and the Hertz brand is one of the most recognized globally. Product and service initiatives such as Hertz Gold Plus Rewards, Ultimate Choice, Carfirmations, Mobile Wi-Fi and unique vehicles offered through its specialty collections set Hertz apart from the competition. Additionally, The Hertz Corporation owns the vehicle leasing and fleet management leader Donlen Corporation, operates the Firefly vehicle rental brand and Hertz 24/7 car sharing business in international markets and sells vehicles through Hertz Car Sales. For more information about The Hertz Corporation, visit: www.hertz.com.
LONDON, June 18, 2019 /PRNewswire/ — Hertz Europe Ltd, part of Hertz Global Holdings, Inc. (NYSE: HTZ) has unveiled "Kollektion 7 – Made in Germany," a new collection of 7 prestige vehicles, celebrating luxury German marques, engineering expertise – and high-end customer service; in the birthplace of the car.
Mercedes-AMG GT, part of the new Kollektion 7 – Made in Germany, exclusively from Hertz
Launching at Frankfurt Airport, the new "Kollektion 7 – Made in Germany" includes prestige vehicles from top German brands: BMW, Mercedes Benz and Porsche. The new country collection proposition, featuring luxurious Kollektion 7-branded lounges, is rolling out to six further locations across Germany, with Düsseldorf and Munich launching later in 2019.
"With the launch of our Kollektion 7 prestige offer we are meeting customer demand for an exceptional driving experience and exclusive service, combined in a stylish leisure offering," said Alida Scholtz, Managing Director of Hertz Germany. "Around the world, the ‘Made in Germany’ moniker is a hallmark of quality and engineering excellence. This new collection brings those values to life – allowing Hertz customers to experience premium automotive and high-end German brands in a unique, engaging, and entertaining way."
Kollektion 7 includes a choice of iconic German models, for a range of driving experiences: the luxury BMW M850i Cabriolet, BMW Z4, Mercedes-AMG GT and Mercedes-AMG GT 63 4-door coupe, Porsche 718 Boxster, Porsche Macan S, and Porsche Panamera E-Hybrid. All models will be available in the colours of the German flag: black, red and yellow.
Each of the seven locations will offer customers a unique, city-specific driving experience, giving visitors the opportunity to get to know the specific characteristics of different regions – and to discover what makes Germany so special, with unique insights from Hertz. Guests can also start sampling the local gastronomic treats as soon as they enter their chosen vehicle, thanks to a gift basket which provides a sample of local fare.
The two BMW convertibles – the BMW M850i Cabriolet and the BMW Z4 – offer a choice of options for the summer. The models combine sportiness with progressive design and exceptional comfort. Thanks to state-of-the-art technology and performance of 258 hp on the Z4, and 530 hp in the 8-cylinder twin-turbo BMW M850i, both offer an outstanding driving experience.
Currently available exclusively from Hertz, the Mercedes-AMG GT has been used as a safety car in Formula 1 since 2015. With a top speed of 304 km / h, the Mercedes-AMG GT combines sports car heritage with practicality. The Mercedes-AMG GT 63 4-door coupé is a top-of-the-range four-door model, and accelerates from 0 to 100 km / h in just 3.4 seconds.
There are three models from Porsche in the Kollektion 7. The Porsche 718 Boxster combines the spirit of the legendary Boxster series with striking design and, for the first time, a turbocharged 4-cylinder Boxer engine. The compact SUV Porsche Macan S blends sportiness, design and practicality with impressive efficiency – an ideal choice for family outings. The Porsche Panamera E-Hybrid, meanwhile, demonstrates that top performance is also sustainable. With the electric sedan, drivers can cover 50 kilometres purely on electric power – and with the additional petrol engine, the Porsche offers 462 hp.
A themed Kollektion 7 lounge, featuring a dedicated logo in black, red and yellow, enables customers to relax in comfort ahead of their journey. Kollektion 7 customers benefit from comprehensive additional benefits such as a concierge service that accompanies customers to the Kollektion 7 pick-up areas and introduces them to the highlights of the vehicles. as well as a pick-up and preferred return service, for an accelerated rental experience.
Kollektion 7: Made in Germany is the latest example of Hertz’s commitment to meet every customer’s need including offering the best premium fleet options and luxury, tailored experiences across its markets. The Hertz premium fleet offer is supported by the current international marketing campaign; "Cars so great you’ll never want to get out".
Earlier this year Hertz launched its British Collection in the UK – a premium customer service rental offer, featuring a suite of Best-of-British services and products, with models including the Land Rover Discovery Sport and the Jaguar F Pace, E Pace, XE and XF.
More recently, Hertz expanded its Selezione Italia offer to include the Alfa Romeo Giulia Quadrifoglio, the most powerful production Alfa ever built.
Terms and conditions apply. For bookings and further information please visit www.hertz.com
*Customers choosing Kollektion 7: Made in Germany benefit from 7 high-end customer service benefits:
A make-and-model guarantee – meaning that the car booked is the one they drive away with
Pre-pick up courtesy call
Expedited rental experience (and lounge)
Gate pick-up and escort to Kollektion 7 pick up area
Dedicated staff to introduce you to highlights of the car
7 inspirational driving itineraries, showcasing the best of Germany
Expedited return service and post-rental follow up
ABOUT HERTZ The Hertz Corporation, a subsidiary of Hertz Global Holdings, Inc., operates the Hertz, Dollar and Thrifty vehicle rental brands in approximately 10,200 company-owned, licensee and franchisee locations throughout North America, Europe, The Caribbean, Latin America, Africa, the Middle East, Asia, Australia and New Zealand. The Hertz Corporation is one of the largest worldwide rental companies, and the Hertz brand is one of the most recognized in the world. Product and service initiatives such as Hertz Gold Plus Rewards, Ultimate Choice, Carfirmations, Mobile Wi-Fi and unique vehicles offered through its specialty collections set Hertz apart from the competition. Additionally, The Hertz Corporation owns the vehicle leasing and fleet management leader Donlen, operates the Firefly vehicle rental brand and Hertz 24/7 car sharing business in international markets, and sells vehicles through Hertz Car Sales. For more information about The Hertz Corporation, visit: www.hertz.com.
ESTERO, Fla., June 13, 2019 /PRNewswire/ — Hertz Global Holdings, Inc. (NYSE: HTZ) ("Hertz Global" or the "Company") today announced that its board of directors has approved a rights offering to raise proceeds of up to $750 million. Pursuant to the rights offering, each stockholder of the Company will receive one transferable subscription right ("right") for each share of common stock held as of 5:00 p.m., Eastern Time, on June 24, 2019 (the "record date"). The rights offering will be made only by means of a prospectus, and this announcement does not constitute an offer to sell, or a solicitation of an offer to buy, any of the Company’s securities.
SUMMARY OF THE TERMS OF THE OFFERING
Each right entitles the holder to purchase 0.688285 shares of the Company’s common stock (the "basic subscription right"), at the subscription price of $12.95 per whole share of common stock (the "subscription price").
Rights holders who fully exercise their basic subscription rights will be entitled to subscribe for additional shares of the Company’s common stock that remain unsubscribed as a result of any unexercised basic subscription rights (the "over-subscription right"). The over-subscription right allows a rights holder to subscribe for additional shares of the Company’s common stock at the subscription price on a pro rata basis.
No fractional shares of common stock will be issued in the rights offering. Any fractional shares of common stock created by the exercise of the rights will be rounded down to the nearest whole share.
The distribution of the rights is expected to commence on June 26, 2019 to stockholders of record as of the record date.
Trading in the rights on the New York Stock Exchange (the "NYSE") is expected to begin on a "when-issued" basis on June 20, 2019 under the symbol "HTZ RTWI". Trading in the rights on the NYSE is expected to begin on a "regular way" basis on June 27, 2019 under the symbol "HTZ RT" and continue until the close of trading on the NYSE on July 11, 2019 (or if the offer is extended, on the business day immediately prior to the extended expiration date).
The rights offering expires at 5:00 p.m., Eastern Time, on July 12, 2019 (the "expiration date"), unless extended by the Company.
The subscription agent for the rights offering will send a rights certificate to each registered holder of the Company’s common stock as of the close of business on the record date, based on the Company’s stockholder registry maintained at the transfer agent for its common stock. Holders of shares of common stock in "street name" through a brokerage account, bank, or other nominee will not receive a physical rights certificate, and instead, such holders must instruct their broker, bank, or nominee whether or not to exercise subscription rights on their behalf. For any questions or further information about the rights offering, please call Georgeson LLC, the information agent for the rights offering, at (888) 607-6511 (toll‑free).
The rights offering will be made pursuant to the Company’s effective shelf registration statement on Form S-3 (Reg. No. 333- 231878) on file with the Securities and Exchange Commission (the "SEC") and a prospectus supplement to be filed with the SEC prior to the commencement of the rights offering.
The information herein is not complete and is subject to change. This press release does not constitute an offer to sell or the solicitation of an offer to buy any of the rights, common stock or any other securities, nor will there be any sale of the rights, common stock or any other securities in any state or other jurisdiction in which such offer, solicitation or sale would be unlawful prior to registration or qualification under the securities laws of any such state or other jurisdiction. This document is not an offering, which can only be made by a prospectus. The base prospectus contains this and additional information about the Company and the prospectus supplement will contain this and additional information about the rights offering, and should be read carefully before investing. For any questions or further information about the rights offering, or to obtain a prospectus supplement and the accompanying prospectus, when available, please contact Georgeson LLC, the information agent for the rights offering, at (888) 607-6511 (toll‑free).
RIGHTS OFFERING WEBCAST
On June 13, 2019 at 8:30 a.m., Eastern Time, the Company will conduct a live webcast and conference call to discuss the rights offering, which can be accessed through a link on the Investor Relations section of the Hertz website, IR.Hertz.com, or by dialing (800) 230-1074 or (612) 234-9960. Certain financial information relating to the Company’s second quarter 2019 outlook will be discussed on the webcast and is included in the prospectus supplement to be filed related to the rights offering. The webcast will include discussion of a non-GAAP financial measure that is detailed in the prospectus supplement to be filed related to the rights offering.
ABOUT HERTZ
The Hertz Corporation, a subsidiary of Hertz Global Holdings, Inc., operates the Hertz, Dollar and Thrifty vehicle rental brands in approximately 10,200 company-owned, licensee and franchisee locations throughout North America, Europe, the Caribbean, Latin America, Africa, the Middle East, Asia, Australia and New Zealand. The Hertz Corporation is one of the largest worldwide vehicle rental companies. Product and service initiatives such as Hertz Gold Plus Rewards, Ultimate Choice, Carfirmations, Mobile Wi-Fi and unique vehicles offered through its specialty collections set Hertz apart from the competition. Additionally, The Hertz Corporation owns the vehicle leasing and fleet management leader Donlen Corporation, operates the Firefly vehicle rental brand and Hertz 24/7 car sharing business in international markets and sells vehicles through Hertz Car Sales.
Certain statements contained in this release include "forward-looking statements." Forward-looking statements include information concerning the rights offering, the Company’s liquidity and its possible or assumed future results of operations, including descriptions of its business strategies. These statements often include words such as "believe," "expect," "project," "potential," "anticipate," "intend," "plan," "estimate," "seek," "will," "may," "would," "should," "could," "forecasts" or similar expressions. These statements are based on certain assumptions that the Company has made in light of its experience in the industry as well as its perceptions of historical trends, current conditions, expected future developments and other factors it believes are appropriate in these circumstances. The Company believes these judgments are reasonable, but you should understand that these statements are not guarantees of performance or results, and the Company’s actual results could differ materially from those expressed in the forward-looking statements due to a variety of important factors, both positive and negative, that may be revised or supplemented in subsequent reports on Forms 10-K, 10-Q and 8-K filed or furnished to the Securities and Exchange Commission ("SEC").
Among other items, such factors could include: whether the Company will distribute rights on June 26, 2019 to its stockholders of record; whether stockholders of record will have until July 12, 2019 to exercise their rights; the Company’s expectations that the rights will be admitted for trading on the NYSE; the expiration date of the rights offering; the levels of travel demand, particularly with respect to airline passenger traffic in the United States and in global markets; the effect of the Company’s separation of its vehicle and equipment rental businesses, any failure by Herc Holdings Inc. to comply with the agreements entered into in connection with the separation and the Company’s ability to obtain the expected benefits of the separation; significant changes in the competitive environment and the effect of competition in the Company’s markets on rental volume and pricing, including on the Company’s pricing policies or use of incentives; occurrences that disrupt rental activity during the Company’s peak periods; the Company’s ability to accurately estimate future levels of rental activity and adjust the number and mix of vehicles used in its rental operations accordingly; increased vehicle costs due to declines in the value of the Company’s non-program vehicles; the Company’s ability to maintain sufficient liquidity and the availability to it of additional or continued sources of financing for its revenue earning vehicles and to refinance its existing indebtedness; the Company’s ability to purchase adequate supplies of competitively priced vehicles and risks relating to increases in the cost of the vehicles it purchases; the Company’s ability to adequately respond to changes in technology and customer demands; the Company’s ability to retain customer loyalty and market share; the Company’s recognition of previously deferred tax gains on the disposition of revenue earning vehicles; an increase in the Company’s vehicle costs or disruption to its rental activity, particularly during its peak periods, due to safety recalls by the manufacturers of its vehicles; the Company’s access to third-party distribution channels and related prices, commission structures and transaction volumes; the Company’s ability to execute a business continuity plan; a major disruption in the Company’s communication or centralized information networks; a failure to maintain, upgrade and consolidate the Company’s information technology networks; financial instability of the manufacturers of the Company’s vehicles; any impact on the Company from the actions of its franchisees, dealers and independent contractors; the Company’s ability to sustain operations during adverse economic cycles and unfavorable external events (including war, terrorist acts, natural disasters and epidemic disease); shortages of fuel and increases or volatility in fuel costs; the Company’s ability to maintain favorable brand recognition and a coordinated branding and portfolio strategy; the Company’s ability to maintain an effective employee retention and talent management strategy and resulting changes in personnel and employee relations; costs and risks associated with litigation and investigations; risks related to the Company’s indebtedness, including its substantial amount of debt, its ability to incur substantially more debt, the fact that substantially all of its consolidated assets secure certain of its outstanding indebtedness and increases in interest rates or in its borrowing margins; the Company’s ability to meet the financial and other covenants contained in its senior credit facilities and letter of credit facility, its outstanding unsecured senior notes, its outstanding senior second priority secured notes and certain asset-backed and asset-based arrangements; changes in accounting principles, or their application or interpretation, and the Company’s ability to make accurate estimates and the assumptions underlying the estimates, which could have an effect on operating results; risks associated with operating in many different countries, including the risk of a violation or alleged violation of applicable anticorruption or antibribery laws and the Company’s ability to repatriate cash from non-U.S. affiliates without adverse tax consequences; the Company’s ability to prevent the misuse or theft of information it possesses, including as a result of cyber security breaches and other security threats; changes in the existing, or the adoption of new laws, regulations, policies or other activities of governments, agencies and similar organizations, such as the adoption of new regulations under the Tax Cuts and Jobs Act, where such actions may affect the Company’s operations, the cost thereof or applicable tax rates; risks relating to the Company’s deferred tax assets, including the risk of an "ownership change" under the Internal Revenue Code of 1986, as amended; the Company’s exposure to uninsured claims in excess of historical levels; fluctuations in interest rates and commodity prices; the Company’s exposure to fluctuations in foreign currency exchange rates and other risks and uncertainties described from time to time in periodic and current reports that the Company files with the SEC.
Additional information concerning these and other factors can be found in the Company’s filings with the SEC, including the prospectus supplement to be filed with the SEC relating to the rights offering, its Annual Reports on Form 10-K, Quarterly Reports on Form 10-Q and Current Reports on Form 8-K.
You should not place undue reliance on forward-looking statements. All forward-looking statements attributable to the Company or persons acting on its behalf are expressly qualified in their entirety by the foregoing cautionary statements. All such statements speak only as of the date made, and the Company undertakes no obligation to update or revise publicly any forward-looking statements, whether as a result of new information, future events or otherwise.
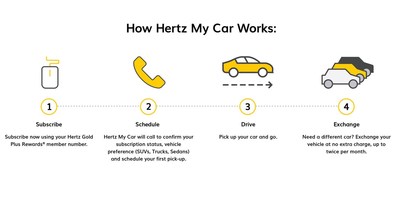
ESTERO, Fla., June 4, 2019 /PRNewswire/ — The Hertz Corporation, (NYSE: HTZ) one of the world’s largest car rental companies, today announced a vehicle-subscription service that will give customers even more flexibility and freedom with their transportation needs. Hertz My Car, which is available in Atlanta, Georgia and Austin, Texas, will give customers access to Hertz’s best fleet ever, including a diverse range of sedans, crossovers, SUVs and trucks through a convenient, all-inclusive monthly subscription. Hertz will offer two tiers of the program to best suit customers’ preferences.
"Hertz My Car enables customers to choose vehicles that best match their needs and offers freedom and flexibility from vehicle ownership and maintenance costs, which is especially appealing to those seeking alternatives to owning or leasing a car," said Jayesh Patel, Hertz Senior Vice President of Brand. "Atlanta and Austin are prime testing grounds with diverse and progressive communities and we look forward to combining the insights we gain there with our fleet management and service expertise to expand Hertz My Car leveraging our extensive network of more than 3,500 Hertz locations nationwide."
Consumer preferences toward vehicle ownership and leasing are shifting. According to a survey by Cox Automotive, nearly 40 percent of those surveyed said that while access to transportation is necessary, owning a vehicle is not. For urban respondents, 57 percent said private vehicle ownership is not necessary to get from point A to point B.
For consumers interested in vehicle subscription, Hertz My Car provides a hassle-free, all-inclusive solution that gives customers access to a wide variety of vehicles that fit their budget and needs, and with no long-term commitments.
How Hertz My Car Works Subscribers to Hertz My Car have the flexibility to choose from two subscription tiers. Tier One, at $999* includes full-size sedans, small SUVs and trucks, while Tier Two offers luxury sedans, regular SUVs and large trucks for $1,399*. Customers can exchange their vehicle twice a month to another make or model within the tier so they always have the vehicle that best fits their needs. The all-inclusive monthly subscription covers vehicle maintenance, roadside assistance, vehicle damage and limited liability protection.
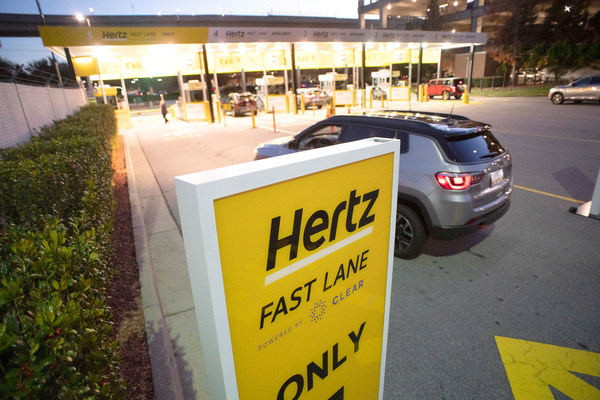
"As we see consumer transportation needs change, it’s an exciting time to further evolve our products and services to deliver on our value proposition – at Hertz, we’re here to get you there," said Patel. "We feel well positioned to lead in vehicle subscription services. We’ve seen growth in our longer-term rentals in recent years which we believe is one of several positive indicators the time is right for this service. We also have a strong and consistent focus on enhancing our customers’ experience including recent innovations such as our redesigned mobile app and Hertz Fast Lane powered by CLEAR that gets customers on the road faster than before."
Innovative and Evolving Mobility Solutions Hertz My Car is part of Hertz’s continued commitment to meet consumers’ unique and individual transportation needs with a wide variety of innovative transportation solutions domestically and globally. Hertz My Car is Hertz’s first subscription service in the U.S. that builds on its multi-month rental program. The company also provides ride-hailing rental programs, corporate rental and vehicle leasing programs, and sells used vehicles through Hertz Car Sales and Hertz Rent2Buy. Hertz also recently launched a weekend vehicle subscription program in Italy – My Hertz Weekend and provides chauffer services and the touchless, hourly car rental program Hertz 24/7 in select international markets.
*Taxes excluded. Upon subscription approval, there is a one-time enrollment fee of $250. Terms & conditions apply.
ABOUT HERTZ The Hertz Corporation, a subsidiary of Hertz Global Holdings, Inc., operates the Hertz, Dollar, Thrifty and Firefly vehicle rental brands in approximately 10,200 corporate and franchisee locations throughout North America, Europe, The Caribbean, Latin America, Africa, the Middle East, Asia, Australia and New Zealand. The Hertz Corporation is one of the largest worldwide rental companies, and the Hertz brand is one of the most recognized in the world. Product and service initiatives such as Hertz Gold Plus Rewards, Ultimate Choice, Carfirmations, Mobile Wi-Fi and unique vehicles offered through its specialty collections set Hertz apart from the competition. Additionally, The Hertz Corporation owns the vehicle leasing and fleet management leader Donlen, operates the Hertz 24/7 car sharing business in international markets, and sells vehicles through Hertz Car Sales. For more information about The Hertz Corporation, visit: www.hertz.com.
ESTERO, Fla., May 15, 2019 /PRNewswire/ — Hertz officially launched its new scholarship program as part of the company’s commitment to community impact through global giving and volunteerism. Through the Hertz Scholarship Program, the company has committed to providing financial support during the 2019-2020 academic year to more than 125 individuals from different backgrounds.
The Hertz Scholarship Program is the centerpiece of the company’s education pillar, which is intended to help deserving students pursue postsecondary education, including vocational school, to develop meaningful careers. The company’s other global giving and volunteerism pillars are disaster relief and environmental stewardship.
In an effort to support Hertz employees and their families living in North America and Europe, the company is offering scholarships to employees’ dependents who have financial need. Hertz is also providing need-based awards to community members living in key areas where Hertz has a strong presence, including Bay Area (California); Boston, Massachusetts; Denver, Colorado; Hawaii; Minneapolis, Minnesota; and Salt Lake City, Utah.
In addition to these need-based awards, the Hertz Scholarship Program will award merit-based scholarships to students pursuing degrees in areas related to information technology and revenue management at select universities as well as interning at the company’s global headquarters in Estero.
"We’re thrilled to officially launch the Hertz Scholarship Program," said Leslie Hunziker, Senior Vice President, Investor Relations, Corporate Communications, and Sustainability. "It’s a great way to support our employees, our communities and the next generation of promising young minds. The Hertz Scholarship Program is one important way we’re doing this, and we plan to continue making a positive impact globally through our charitable giving and volunteerism efforts."
To learn more about and apply for a scholarship, visit:
The application period for the 2019-2020 academic year runs from May 9 through June 6. If you have any questions, please email hertzcommunity@scholarshipamerica.org or phone 1-507-931-1682 and ask for The Hertz Scholarship.
Note: The Hertz Scholarship Program, with the exception of the internship program, is being administered by the leading educational non-profit, Scholarship America.
ABOUT HERTZ The Hertz Corporation, a subsidiary of Hertz Global Holdings, Inc., operates the Hertz, Dollar, Thrifty and Firefly vehicle rental brands in approximately 10,200 corporate and franchisee locations throughout North America, Europe, The Caribbean, Latin America, Africa, the Middle East, Asia, Australia and New Zealand. The Hertz Corporation is one of the largest worldwide rental companies, and the Hertz brand is one of the most recognized in the world. Product and service initiatives such as Hertz Gold Plus Rewards, Ultimate Choice, Carfirmations, Mobile Wi-Fi and unique vehicles offered through its specialty collections set Hertz apart from the competition. Additionally, The Hertz Corporation owns the vehicle leasing and fleet management leader Donlen, operates the Hertz 24/7 car sharing business in international markets, and sells vehicles through Hertz Car Sales. For more information about The Hertz Corporation, visit: www.hertz.com.
ESTERO, Fla., May 6, 2019 /PRNewswire/ — Hertz Global Holdings, Inc. (NYSE: HTZ) ("Hertz Global" or the "Company") today reported results for its first quarter 2019.
First Quarter 2019 Compared to First Quarter 2018:
Total revenues up 2%, up 4% on a constant currency basis
U.S. RAC total revenues up 7%: Transaction Days up 4%, Total RPD up 2%
U.S. RAC Depreciation Per Unit Per Month decreased 15%
Net loss attributable to Hertz Global improved 27%
Adjusted Corporate EBITDA improved 93%
"We continue to drive profitable revenue growth with focus and discipline. In the first quarter, our solid results reflect increased revenue per unit and improved operating margin through strong pricing, volume and fleet management," said Kathryn V. Marinello, President and Chief Executive Officer of Hertz Global. "These catalysts, coupled with expanding capabilities in service excellence, marketing segmentation and innovation, and supported by our commitment to operating efficiency, position the company for predictable, sustainable growth, while allowing us to capitalize on strategic opportunities going forward."
For the first quarter 2019, total revenues were $2.1 billion, a 2% increase versus the first quarter 2018. Net loss attributable to Hertz Global was $147 million, or $1.75 loss per diluted share, compared to $202 million, or $2.43 loss per diluted share. The Company reported Adjusted Net Loss for the first quarter 2019 of $83 million, or $0.99 Adjusted Diluted Loss Per Share, compared to $131 million, or $1.58, for the same period last year. Adjusted Corporate EBITDA was a negative $4 million, compared to negative $59 million.
U.S. RENTAL CAR ("U.S. RAC") SUMMARY
U.S. RAC(1)
Three Months Ended March 31,
Percent Inc/(Dec)
($ in millions, except where noted)
2019
2018
Total revenues
$
1,520
$
1,426
7
%
Depreciation of revenue earning vehicles and lease charges
$
386
$
434
(11)
%
Direct vehicle operating ("DOE") and selling, general & administrative ("SG&A") expenses
$
1,097
$
1,026
7
%
DOE and SG&A expenses as a percentage of total revenues
72
%
72
%
20
bps
Income (loss) before income taxes
$
14
$
(68)
NM
Adjusted Pre-tax Income (Loss)
$
25
$
(48)
NM
Adjusted Pre-tax Margin
2
%
(3)
%
500
bps
Adjusted Corporate EBITDA
$
7
$
(48)
NM
Adjusted Corporate EBITDA Margin
—
%
(3)
%
380
bps
Average Vehicles (in whole units)
501,767
478,600
5
%
Vehicle Utilization
79
%
79
%
(60)
bps
Transaction Days (in thousands)
35,582
34,203
4
%
Total RPD (in whole dollars)
$
41.90
$
40.93
2
%
Total RPU Per Month (in whole dollars)
$
990
$
975
2
%
Depreciation Per Unit Per Month (in whole dollars)
$
256
$
302
(15)
%
NM – Not Meaningful
Total U.S. RAC revenues increased 7% compared to the first quarter of 2018. Transaction days grew 4% driven by expanding volume to transportation network company drivers ("TNC"). Pricing, as measured by Total Revenue Per Transaction Day (Total RPD), increased 2% in the quarter, and time and mileage pricing was up 4%, driven by our highest-profit leisure categories and the TNC business year-over-year.
Average vehicles were up 5%, driven by 85% growth in the Company’s TNC fleet. Excluding TNC, average vehicles were up 1%. Higher revenue and stable Utilization led to a 2% increase in Total RPU, an important measure of asset efficiency.
Depreciation Per Unit Per Month decreased 15% on favorable vehicle acquisition prices, continued strength in residual values and an increase in the number of vehicle dispositions through the Company’s higher-return channels year over year.
Adjusted Corporate EBITDA improved $55 million in the first quarter and Adjusted Corporate EBITDA Margin expanded 380 basis points, driven by higher revenue and lower vehicle depreciation.
INTERNATIONAL RENTAL CAR ("INTERNATIONAL RAC") SUMMARY
International RAC(1)
Three Months Ended March 31,
Percent Inc/(Dec)
($ in millions, except where noted)
2019
2018
Total revenues
$
433
$
468
(7)
%
Depreciation of revenue earning vehicles and lease charges
$
97
$
102
(5)
%
DOE and SG&A expenses
$
338
$
360
(6)
%
DOE and SG&A expenses as a percentage of total revenues
78
%
77
%
110
bps
Income (loss) before income taxes
$
(24)
$
(12)
100
%
Adjusted Pre-tax Income (Loss)
$
(18)
$
(6)
200
%
Adjusted Pre-tax Margin
(4)
%
(1)
%
(290)
bps
Adjusted Corporate EBITDA
$
(13)
$
—
NM
Adjusted Corporate EBITDA Margin
(3)
%
—
%
(300)
bps
Average Vehicles (in whole units)
152,747
148,700
3
%
Vehicle Utilization
74
%
75
%
(90)
bps
Transaction Days (in thousands)
10,127
9,974
2
%
Total RPD (in whole dollars)
$
42.56
$
43.41
(2)
%
Total RPU Per Month (in whole dollars)
$
941
$
971
(3)
%
Depreciation Per Unit Per Month (in whole dollars)
$
212
$
211
—
%
NM – Not Meaningful
Total International RAC revenues decreased 7% year over year, and were flat on a constant currency basis. Volume was up 2% driven by strong business and leisure growth in Asia Pacific. Total RPD was down 2% partly due to the timing of the Easter holiday in 2019 versus 2018.
Adjusted Corporate EBITDA was impacted by the decline in revenue, partially offset by lower direct operating expense.
ALL OTHER OPERATIONS SUMMARY
All Other Operations(1)
Three Months Ended March 31,
Percent Inc/(Dec)
($ in millions)
2019
2018
Total revenues
$
154
$
169
(9)
%
Depreciation of revenue earning vehicles and lease charges
$
109
$
125
(13)
%
DOE and SG&A expenses
$
13
$
19
(32)
%
DOE and SG&A expenses as a percentage of total revenues
8
%
11
%
(280)
bps
Income (loss) before income taxes
$
24
$
19
26
%
Adjusted Pre-tax Income (Loss)
$
25
$
22
14
%
Adjusted Pre-tax Margin
16
%
13
%
320
bps
Adjusted Corporate EBITDA
$
22
$
20
10
%
Adjusted Corporate EBITDA Margin
14
%
12
%
250
bps
Average Vehicles (in whole units) – Donlen
192,799
191,600
1
%
All Other Operations primarily is comprised of the Company’s Donlen leasing operations. Lower year-over-year revenue and depreciation of revenue earning vehicles and lease charges were driven by the impact of a change in presentation for certain leased vehicles in the first quarter of 2019 versus 2018.
(1)
Adjusted Pre-tax Income (Loss), Adjusted Pre-tax Margin, Adjusted Corporate EBITDA, Adjusted Corporate EBITDA Margin, Adjusted Net Income (Loss) and Adjusted Diluted Earnings (Loss) Per Share are non-GAAP measures. Average Vehicles, Transaction Days, Total RPD, Total RPU Per Month and Depreciation Per Unit Per Month are key metrics. See the accompanying Supplemental Schedules and Definitions for the reconciliations and definitions for each of these non-GAAP measures and key metrics and the reason the Company’s management believes that this information is useful to investors.
RESULTS OF THE HERTZ CORPORATION
The GAAP and non-GAAP profitability metrics for Hertz Global’s operating subsidiary, The Hertz Corporation ("Hertz"), are materially the same as those for Hertz Global.
EARNINGS WEBCAST INFORMATION
Hertz Global’s live webcast and conference call to discuss its first quarter 2019 results will be held on May 7, 2019, at 8:30 a.m. Eastern Time, and can be accessed through a link on the Investor Relations section of the Hertz website, IR.Hertz.com, or by dialing (800) 230-1085 and providing passcode 466474. Investors are encouraged to dial-in approximately 10 minutes prior to the call. A web replay will remain available for approximately one year. A telephone replay will be available one hour following the conclusion of the call for one year at (800) 475-6701 with pass code 466474.
The earnings release and related supplemental schedules containing the reconciliations of non-GAAP measures will be available on the Hertz website, IR.Hertz.com.
SELECTED FINANCIAL AND OPERATING DATA, SUPPLEMENTAL SCHEDULES AND DEFINITIONS
Following are tables that present selected financial and operating data of Hertz Global. Also included are Supplemental Schedules, which are provided to present segment results, and reconciliations of non-GAAP measures to their most comparable GAAP measure. Following the Supplemental Schedules, the Company provides definitions for terminology used throughout this earnings release and provides the usefulness of non-GAAP measures to investors and additional purposes for which management uses such measures.
ABOUT HERTZ
The Hertz Corporation, a subsidiary of Hertz Global Holdings, Inc., operates the Hertz, Dollar and Thrifty vehicle rental brands in approximately 10,200 company-owned, licensee and franchisee locations throughout North America, Europe, the Caribbean, Latin America, Africa, the Middle East, Asia, Australia and New Zealand. The Hertz Corporation is one of the largest worldwide vehicle rental companies, and the Hertz brand is one of the most recognized globally. Product and service initiatives such as Hertz Gold Plus Rewards, Ultimate Choice, Carfirmations, Mobile Wi-Fi and unique vehicles offered through its specialty collections set Hertz apart from the competition. Additionally, The Hertz Corporation owns the vehicle leasing and fleet management leader Donlen Corporation, operates the Firefly vehicle rental brand and Hertz 24/7 car sharing business in international markets and sells vehicles through Hertz Car Sales. For more information about The Hertz Corporation, visit: www.hertz.com.
Certain statements contained in this release, and in related comments by the Company’s management, include "forward-looking statements." Forward-looking statements include information concerning the Company’s liquidity and its possible or assumed future results of operations, including descriptions of its business strategies. These statements often include words such as "believe," "expect," "project," "potential," "anticipate," "intend," "plan," "estimate," "seek," "will," "may," "would," "should," "could," "forecasts" or similar expressions. These statements are based on certain assumptions that the Company has made in light of its experience in the industry as well as its perceptions of historical trends, current conditions, expected future developments and other factors it believes are appropriate in these circumstances. The Company believes these judgments are reasonable, but you should understand that these statements are not guarantees of performance or results, and the Company’s actual results could differ materially from those expressed in the forward-looking statements due to a variety of important factors, both positive and negative, that may be revised or supplemented in subsequent reports on Forms 10-K, 10-Q and 8-K filed or furnished to the Securities and Exchange Commission ("SEC"). Among other items, such factors could include: levels of travel demand, particularly with respect to airline passenger traffic in the United States and in global markets; the effect of the Company’s separation of its vehicle and equipment rental businesses, any failure by Herc Holdings Inc. to comply with the agreements entered into in connection with the separation and the Company’s ability to obtain the expected benefits of the separation; significant changes in the competitive environment and the effect of competition in the Company’s markets on rental volume and pricing, including on the Company’s pricing policies or use of incentives; occurrences that disrupt rental activity during the Company’s peak periods; the Company’s ability to accurately estimate future levels of rental activity and adjust the number and mix of vehicles used in its rental operations accordingly; increased vehicle costs due to declines in the value of the Company’s non-program vehicles; the Company’s ability to maintain sufficient liquidity and the availability to it of additional or continued sources of financing for its revenue earning vehicles and to refinance its existing indebtedness; the Company’s ability to purchase adequate supplies of competitively priced vehicles and risks relating to increases in the cost of the vehicles it purchases; the Company’s ability to adequately respond to changes in technology and customer demands; the Company’s ability to retain customer loyalty and market share; the Company’s recognition of previously deferred tax gains on the disposition of revenue earning vehicles; an increase in the Company’s vehicle costs or disruption to its rental activity, particularly during its peak periods, due to safety recalls by the manufacturers of its vehicles; the Company’s access to third-party distribution channels and related prices, commission structures and transaction volumes; the Company’s ability to execute a business continuity plan; a major disruption in the Company’s communication or centralized information networks; a failure to maintain, upgrade and consolidate the Company’s information technology networks; financial instability of the manufacturers of the Company’s vehicles; any impact on the Company from the actions of its franchisees, dealers and independent contractors; the Company’s ability to sustain operations during adverse economic cycles and unfavorable external events (including war, terrorist acts, natural disasters and epidemic disease); shortages of fuel and increases or volatility in fuel costs; the Company’s ability to maintain favorable brand recognition and a coordinated branding and portfolio strategy; the Company’s ability to maintain an effective employee retention and talent management strategy and resulting changes in personnel and employee relations; costs and risks associated with litigation and investigations; risks related to the Company’s indebtedness, including its substantial amount of debt, its ability to incur substantially more debt, the fact that substantially all of its consolidated assets secure certain of its outstanding indebtedness and increases in interest rates or in its borrowing margins; the Company’s ability to meet the financial and other covenants contained in its senior credit facilities and letter of credit facility, its outstanding unsecured senior notes, its outstanding senior second priority secured notes and certain asset-backed and asset-based arrangements; changes in accounting principles, or their application or interpretation, and the Company’s ability to make accurate estimates and the assumptions underlying the estimates, which could have an effect on operating results; risks associated with operating in many different countries, including the risk of a violation or alleged violation of applicable anticorruption or antibribery laws and the Company’s ability to repatriate cash from non-U.S. affiliates without adverse tax consequences; the Company’s ability to prevent the misuse or theft of information it possesses, including as a result of cyber security breaches and other security threats; changes in the existing, or the adoption of new laws, regulations, policies or other activities of governments, agencies and similar organizations, such as the adoption of new regulations under the Tax Cuts and Jobs Act, where such actions may affect the Company’s operations, the cost thereof or applicable tax rates; risks relating to the Company’s deferred tax assets, including the risk of an "ownership change" under the Internal Revenue Code of 1986, as amended; the Company’s exposure to uninsured claims in excess of historical levels; fluctuations in interest rates and commodity prices; the Company’s exposure to fluctuations in foreign currency exchange rates and other risks and uncertainties described from time to time in periodic and current reports that the Company files with the SEC.
Additional information concerning these and other factors can be found in the Company’s filings with the SEC, including its Annual Reports on Form 10-K, Quarterly Reports on Form 10-Q and Current Reports on Form 8-K.
You should not place undue reliance on forward-looking statements. All forward-looking statements attributable to the Company or persons acting on its behalf are expressly qualified in their entirety by the foregoing cautionary statements. All such statements speak only as of the date made, and the Company undertakes no obligation to update or revise publicly any forward-looking statements, whether as a result of new information, future events or otherwise.
FINANCIAL INFORMATION AND OPERATING DATA
SELECTED UNAUDITED CONSOLIDATED INCOME STATEMENT DATA
Three Months Ended March 31,
As a Percentage of Total Revenues
(In millions, except per share data)
2019
2018
2019
2018
Total revenues
$
2,107
$
2,063
100
%
100
%
Expenses:
Direct vehicle and operating
1,266
1,236
60
%
60
%
Depreciation of revenue earning vehicles and lease charges
592
661
28
%
32
%
Selling, general and administrative
234
234
11
%
11
%
Interest expense, net:
Vehicle
112
94
5
%
5
%
Non-vehicle
71
72
3
%
3
%
Total interest expense, net
183
166
9
%
8
%
Other (income) expense, net
(19)
(3)
(1)
%
—
%
Total expenses
2,256
2,294
107
%
111
%
Income (loss) before income taxes
(149)
(231)
(7)
%
(11)
%
Income tax (provision) benefit
1
29
—
%
1
%
Net income (loss)
(148)
(202)
(7)
%
(10)
%
Net (income) loss attributable to noncontrolling interests
1
—
—
%
—
%
Net income (loss) attributable to Hertz Global
$
(147)
$
(202)
(7)
%
(10)
%
Weighted average number of shares outstanding:
Basic
84
83
Diluted
84
83
Earnings (loss) per share:
Basic
$
(1.75)
$
(2.43)
Diluted
$
(1.75)
$
(2.43)
Adjusted Pre-tax Income (Loss)(a)
$
(111)
$
(175)
Adjusted Net Income (Loss)(a)
$
(83)
$
(131)
Adjusted Diluted Earnings (Loss) Per Share(a)
$
(0.99)
$
(1.58)
Adjusted Corporate EBITDA(a)
$
(4)
$
(59)
(a)
Represents a non-GAAP measure, see the accompanying reconciliations included in Supplemental Schedule II.
SELECTED UNAUDITED CONSOLIDATED BALANCE SHEET DATA
(In millions)
As of March 31, 2019
As of December 31, 2018
Cash and cash equivalents
$
554
$
1,127
Total restricted cash and cash equivalents
452
283
Revenue earning vehicles, net:
U.S. Rental Car
9,871
8,793
International Rental Car
2,330
2,146
All Other Operations
1,567
1,480
Total revenue earning vehicles, net
13,768
12,419
Total assets(a)
24,030
21,382
Total debt
17,257
16,324
Net Vehicle Debt(b)
12,442
11,684
Net Non-vehicle Debt(b)
3,904
3,326
Total stockholders’ equity
1,005
1,120
(a)
On January 1, 2019, the Company adopted new lease guidance under U.S. GAAP and recorded a net cumulative-effect adjustment of $1.5 billion to recognize assets associated with the Company’s leases as of that date.
(b)
Represents a non-GAAP measure, see the accompanying reconciliations included in Supplemental Schedule V.
SELECTED UNAUDITED CONSOLIDATED CASH FLOW DATA
Three Months Ended March 31,
(In millions)
2019
2018
Cash flows provided by (used in):
Operating activities
$
514
$
401
Investing activities
(1,855)
(1,850)
Financing activities
939
1,877
Effect of exchange rate changes
(2)
8
Net change in cash, cash equivalents, restricted cash and restricted cash equivalents
$
(404)
$
436
Fleet Growth(a)
$
(413)
$
280
Adjusted Free Cash Flow(a)
$
(578)
$
—
(a)
Represents a non-GAAP measure, see the accompanying reconciliations included in Supplemental Schedules III and IV.
SELECTED UNAUDITED OPERATING DATA BY SEGMENT
Three Months Ended March 31,
Percent Inc/(Dec)
2019
2018
U.S. RAC
Transaction Days (in thousands)
35,582
34,203
4
%
Total RPD(a)
$
41.90
$
40.93
2
%
Total RPU Per Month(a)
$
990
$
975
2
%
Average Vehicles
501,767
478,600
5
%
Vehicle Utilization(a)
79
%
79
%
(60)
bps
Depreciation Per Unit Per Month(a)
$
256
$
302
(15)
%
Percentage of program vehicles at period end
9
%
9
%
(90)
bps
Adjusted Pre-tax Income (Loss) (in millions)(b)
$
25
$
(48)
NM
International RAC
Transaction Days (in thousands)
10,127
9,974
2
%
Total RPD(a)
$
42.56
$
43.41
(2)
%
Total RPU Per Month(a)
$
941
$
971
(3)
%
Average Vehicles
152,747
148,700
3
%
Vehicle Utilization(a)
74
%
75
%
(90)
bps
Depreciation Per Unit Per Month(a)
$
212
$
211
—
%
Percentage of program vehicles at period end
39
%
41
%
(250)
bps
Adjusted Pre-tax Income (Loss) (in millions)(b)
$
(18)
$
(6)
200
%
All Other Operations
Average Vehicles — Donlen
192,799
191,600
1
%
Adjusted Pre-tax Income (Loss) (in millions)(b)
$
25
$
22
14
%
NM – Not meaningful
(a)
See the accompanying calculations of this key metric in Supplemental Schedule VI.
(b)
Represents a non-GAAP measure, see the accompanying reconciliations included in Supplemental Schedule II.
Supplemental Schedule I
Supplemental Schedule I
HERTZ GLOBAL HOLDINGS, INC.
CONDENSED STATEMENT OF OPERATIONS BY SEGMENT
Unaudited
Three Months Ended March 31, 2019
Three Months Ended March 31, 2018
(In millions)
U.S. Rental Car
Int’l Rental Car
All Other Operations
Corporate
Hertz Global
U.S. Rental Car
Int’l Rental Car
All Other Operations
Corporate
Hertz Global
Total revenues:
$
1,520
$
433
$
154
$
—
$
2,107
$
1,426
$
468
$
169
$
—
$
2,063
Expenses:
Direct vehicle and operating
976
284
6
—
1,266
927
300
9
—
1,236
Depreciation of revenue earning vehicles and lease charges
386
97
109
—
592
434
102
125
—
661
Selling, general and administrative
121
54
7
52
234
99
60
10
65
234
Interest expense, net:
Vehicle
77
23
12
—
112
65
20
9
—
94
Non-vehicle
(45)
(1)
(4)
121
71
(31)
(1)
(3)
107
72
Total interest expense, net
32
22
8
121
183
34
19
6
107
166
Other (income) expense, net
(9)
—
—
(10)
(19)
—
(1)
—
(2)
(3)
Total expenses
1,506
457
130
163
2,256
1,494
480
150
170
2,294
Income (loss) before income taxes
$
14
$
(24)
$
24
$
(163)
$
(149)
$
(68)
$
(12)
$
19
$
(170)
$
(231)
Income tax (provision) benefit
1
29
Net income (loss)
$
(148)
$
(202)
Net (income) loss attributable to noncontrolling interests
1
—
Net income (loss) attributable to Hertz Global
$
(147)
$
(202)
Supplemental Schedule II
Supplemental Schedule II
HERTZ GLOBAL HOLDINGS, INC.
RECONCILIATION OF NET INCOME (LOSS) TO GROSS EBITDA, CORPORATE EBITDA, ADJUSTED CORPORATE EBITDA,
ADJUSTED PRE-TAX INCOME (LOSS), ADJUSTED NET INCOME (LOSS) AND ADJUSTED DILUTED EARNINGS (LOSS) PER SHARE
Unaudited
Three Months Ended March 31, 2019
Three Months Ended March 31, 2018
(In millions, except per share data)
U.S. Rental Car
Int’l Rental Car
All Other Operations
Corporate
Hertz Global
U.S. Rental Car
Int’l Rental Car
All Other Operations
Corporate
Hertz Global
Net income (loss)
$
(148)
$
(202)
Income tax provision (benefit)
(1)
(29)
Income (loss) before income taxes
$
14
$
(24)
$
24
$
(163)
$
(149)
$
(68)
$
(12)
$
19
$
(170)
$
(231)
Depreciation and amortization
424
103
111
3
641
477
110
128
4
719
Interest, net of interest income
32
22
8
121
183
34
19
6
107
166
Gross EBITDA
$
470
$
101
$
143
$
(39)
$
675
$
443
$
117
$
153
$
(59)
$
654
Revenue earning vehicle depreciation and lease charges
(386)
(97)
(109)
—
(592)
(434)
(102)
(125)
—
(661)
Vehicle debt interest
(77)
(23)
(12)
—
(112)
(65)
(20)
(9)
—
(94)
Vehicle debt-related charges(a)
5
3
2
—
10
9
2
1
—
12
Corporate EBITDA
$
12
$
(16)
$
24
$
(39)
$
(19)
$
(47)
$
(3)
$
20
$
(59)
$
(89)
Non-cash stock-based compensation charges(b)
—
—
—
3
3
—
—
—
3
3
Restructuring and restructuring related charges(c)
3
—
1
3
7
—
2
—
2
4
Information technology and finance transformation costs(d)
—
—
—
23
23
—
—
—
23
23
Other items(e)
(8)
3
(3)
(10)
(18)
(1)
1
—
—
—
Adjusted Corporate EBITDA
$
7
$
(13)
$
22
$
(20)
$
(4)
$
(48)
$
—
$
20
$
(31)
$
(59)
Non-vehicle depreciation and amortization
(38)
(6)
(2)
(3)
(49)
(43)
(8)
(3)
(4)
(58)
Non-vehicle debt interest, net of interest income
45
1
4
(121)
(71)
31
1
3
(107)
(72)
Non-vehicle debt-related charges(a)
—
—
—
4
4
—
—
—
4
4
Non-cash stock-based compensation charges(b)
—
—
—
(3)
(3)
—
—
—
(3)
(3)
Acquisition accounting(f)
12
—
1
1
14
12
1
2
—
15
Other(g)
(1)
—
—
(1)
(2)
—
—
—
(2)
(2)
Adjusted Pre-tax Income (Loss)(h)
$
25
$
(18)
$
25
$
(143)
$
(111)
$
(48)
$
(6)
$
22
$
(143)
$
(175)
Income tax (provision) benefit on Adjusted Pre-tax Income (Loss)(i)
28
44
Adjusted Net Income (Loss)
$
(83)
$
(131)
Weighted average number of diluted shares outstanding
84
83
Adjusted Diluted Earnings (Loss) Per Share
$
(0.99)
$
(1.58)
Supplemental Schedule II (continued)
(a)
Represents debt-related charges relating to the amortization of deferred financing costs and debt discounts and premiums
(b)
Stock-based compensation expense is an adjustment for purposes of calculating Adjusted Corporate EBITDA but not for calculating Adjusted Pre-tax Income (Loss).
(c)
Represents charges incurred under restructuring actions as defined in U.S. GAAP excluding impairments and asset write-downs. Also includes restructuring related charges such as incremental costs incurred directly supporting business transformation initiatives. Such costs include transition costs incurred in connection with business process outsourcing arrangements and incremental costs incurred to facilitate business process re-engineering initiatives that involve significant organization redesign and extensive operational process changes. In 2018, also includes consulting costs, legal fees, and other expenses related to the previously disclosed accounting review and investigation.
(d)
Represents costs associated with the Company’s information technology and finance transformation programs, both of which are multi-year initiatives to upgrade and modernize the Company’s systems and processes.
(e)
Represents miscellaneous or non-recurring items, and includes amounts attributable to noncontrolling interests. In 2019, also includes an $11 million gain on marketable securities, and an $8 million gain on the sale of non-vehicle capital assets.
(f)
Represents incremental expense associated with amortization of other intangible assets and depreciation of property and equipment relating to acquisition accounting.
(g)
Comprised of items, other than non-cash stock-based compensation charges, that are adjustments for purposes of calculating Adjusted Corporate EBITDA but not for calculating Adjusted Pre-tax Income (Loss).
(h)
Adjustments by caption to arrive at Adjusted Pre-tax Income (Loss) are as follows:
Increase (decrease) to expenses
Three Months Ended March 31,
(In millions)
2019
2018
Direct vehicle and operating
$
(13)
$
(16)
Selling, general and administrative
(29)
(25)
Interest expense, net:
Vehicle
(10)
(12)
Non-vehicle
(4)
(4)
Total interest expense, net
(14)
(16)
Other income (expense), net
19
1
Noncontrolling interests
(1)
—
Total adjustments
$
(38)
$
(56)
(i)
Derived utilizing a combined statutory rate of 25% and 25% for the periods ending March 31, 2019 and 2018, respectively, applied to the respective Adjusted Pre-tax Income (Loss).
Supplemental Schedule III
HERTZ GLOBAL HOLDINGS, INC.
RECONCILIATION OF GAAP TO NON-GAAP MEASURE – FLEET GROWTH
Unaudited
Three Months Ended March 31, 2019
Three Months Ended March 31, 2018
(In millions)
U.S. Rental Car
Int’l Rental Car
All Other Operations
Hertz Global
U.S. Rental Car
Int’l Rental Car
All Other Operations
Hertz Global
Revenue earning vehicles expenditures
$
(3,078)
$
(631)
$
(264)
$
(3,973)
$
(2,892)
$
(487)
$
(186)
$
(3,565)
Proceeds from disposal of revenue earning vehicles
1,382
689
82
2,153
1,102
636
44
1,782
Net revenue earning vehicles capital expenditures
(1,696)
58
(182)
(1,820)
(1,790)
149
(142)
(1,783)
Depreciation and reserves for revenue earning vehicles
451
84
109
644
434
82
125
641
Financing activity related to vehicles:
Borrowings
2,925
580
162
3,667
3,898
1,189
94
5,181
Payments
(2,061)
(562)
(113)
(2,736)
(2,529)
(687)
(67)
(3,283)
Restricted cash changes
(51)
(123)
6
(168)
36
(500)
(12)
(476)
Net financing activity related to vehicles
813
(105)
55
763
1,405
2
15
1,422
Fleet Growth
$
(432)
$
37
$
(18)
$
(413)
$
49
$
233
$
(2)
$
280
Supplemental Schedule IV
HERTZ GLOBAL HOLDINGS, INC.
RECONCILIATION OF GAAP TO NON-GAAP MEASURE – ADJUSTED FREE CASH FLOW
Unaudited
Three Months Ended March 31,
(In millions)
2019
2018
Net cash provided by operating activities
$
514
$
401
Net change in restricted cash and cash equivalents, vehicle
(168)
(476)
Revenue earning vehicles expenditures
(3,973)
(3,565)
Proceeds from disposal of revenue earning vehicles
2,153
1,782
Capital asset expenditures, non-vehicle
(54)
(44)
Proceeds from property and other equipment disposed of or to be disposed of
19
4
Proceeds from issuance of vehicle debt
3,667
5,181
Repayments of vehicle debt
(2,736)
(3,283)
Adjusted Free Cash Flow
$
(578)
$
—
Supplemental Schedule V
HERTZ GLOBAL HOLDINGS, INC.
RECONCILIATION OF GAAP TO NON-GAAP MEASURE – NET DEBT
Unaudited
As of March 31, 2019
As of December 31, 2018
(In millions)
Vehicle
Non- Vehicle
Total
Vehicle
Non- Vehicle
Total
Debt as reported in the balance sheet
$
12,827
$
4,430
$
17,257
$
11,902
$
4,422
$
16,324
Add:
Debt issue costs deducted from debt obligations
40
28
68
39
31
70
Less:
Cash and cash equivalents
—
554
554
—
1,127
1,127
Restricted cash
425
—
425
257
—
257
Net Debt
$
12,442
$
3,904
$
16,346
$
11,684
$
3,326
$
15,010
Supplemental Schedule VI
HERTZ GLOBAL HOLDINGS, INC.
RECONCILIATIONS OF KEY METRICS
REVENUE, UTILIZATION AND DEPRECIATION
Unaudited
U.S. Rental Car
Three Months Ended March 31,
Percent Inc/(Dec)
($ in millions, except where noted)
2019
2018
Total RPD
Revenues
$
1,520
$
1,426
Ancillary retail vehicle sales revenue
(29)
(26)
Total Rental Revenue
$
1,491
$
1,400
Transaction Days (in thousands)
35,582
34,203
Total RPD (in whole dollars)
$
41.90
$
40.93
2
%
Total Revenue Per Unit Per Month
Total Rental Revenue
$
1,491
$
1,400
Average Vehicles
501,767
478,600
Total revenue per unit (in whole dollars)
$
2,971
$
2,925
Number of months in period
3
3
Total RPU Per Month (in whole dollars)
$
990
$
975
2
%
Vehicle Utilization
Transaction Days (in thousands)
35,582
34,203
Average Vehicles
501,767
478,600
Number of days in period
90
90
Available Car Days (in thousands)
45,159
43,074
Vehicle Utilization(a)
79
%
79
%
(60)
bps
Depreciation Per Unit Per Month
Depreciation of revenue earning vehicles and lease charges
$
386
$
434
Average Vehicles
501,767
478,600
Depreciation of revenue earning vehicles and lease charges divided by Average Vehicles (in whole dollars)
$
769
$
907
Number of months in period
3
3
Depreciation Per Unit Per Month (in whole dollars)
$
256
$
302
(15)
%
(a)
Calculated as Transaction Days divided by Available Car Days.
Supplemental Schedule VI (continued)
HERTZ GLOBAL HOLDINGS, INC.
RECONCILIATIONS OF KEY METRICS
REVENUE, UTILIZATION AND DEPRECIATION
Unaudited
International Rental Car
Three Months Ended March 31,
Percent Inc/(Dec)
($ in millions, except where noted)
2019
2018
Total RPD
Revenues
$
433
$
468
Foreign currency adjustment(a)
(2)
(35)
Total Rental Revenue
$
431
$
433
Transaction Days (in thousands)
10,127
9,974
Total RPD (in whole dollars)
$
42.56
$
43.41
(2)
%
Total Revenue Per Unit Per Month
Total Rental Revenue
$
431
$
433
Average Vehicles
152,747
148,700
Total revenue per unit (in whole dollars)
$
2,822
$
2,912
Number of months in period
3
3
Total RPU Per Month (in whole dollars)
$
941
$
971
(3)
%
Vehicle Utilization
Transaction Days (in thousands)
10,127
9,974
Average Vehicles
152,747
148,700
Number of days in period
90
90
Available Car Days (in thousands)
13,747
13,383
Vehicle Utilization(b)
74
%
75
%
(90)
bps
Depreciation Per Unit Per Month
Depreciation of revenue earning vehicles and lease charges
$
97
$
102
Foreign currency adjustment(a)
—
(8)
Adjusted depreciation of revenue earning vehicles and lease charges
$
97
$
94
Average Vehicles
152,747
148,700
Adjusted depreciation of revenue earning vehicles and lease charges divided by Average Vehicles (in whole dollars)
$
635
$
632
Number of months in period
3
3
Depreciation Per Unit Per Month (in whole dollars)
$
212
$
211
—
%
(a)
Based on December 31, 2018 foreign exchange rates.
(b)
Calculated as Transaction Days divided by Available Car Days.
Supplemental Schedule VI (continued)
HERTZ GLOBAL HOLDINGS, INC.
RECONCILIATIONS OF KEY METRICS
REVENUE, UTILIZATION AND DEPRECIATION
Unaudited
Worldwide Rental Car
Three Months Ended March 31,
Percent Inc/(Dec)
($ in millions, except where noted)
2019
2018
Total RPD
Revenues
$
1,953
$
1,894
Ancillary retail vehicle sales revenue
(29)
(26)
Foreign currency adjustment(a)
(2)
(35)
Total Rental Revenue
$
1,922
$
1,833
Transaction Days (in thousands)
45,709
44,177
Total RPD (in whole dollars)
$
42.05
$
41.49
1
%
Total Revenue Per Unit Per Month
Total Rental Revenue
$
1,922
$
1,833
Average Vehicles
654,514
627,300
Total revenue per unit (in whole dollars)
$
2,937
$
2,922
Number of months in period
3
3
Total RPU Per Month (in whole dollars)
$
979
$
974
1
%
Vehicle Utilization
Transaction Days (in thousands)
45,709
44,177
Average Vehicles
654,514
627,300
Number of days in period
90
90
Available Car Days (in thousands)
58,906
56,457
Vehicle Utilization(b)
78
%
78
%
(70)
bps
Depreciation Per Unit Per Month
Depreciation of revenue earning vehicles and lease charges
$
483
$
536
Foreign currency adjustment(a)
—
(8)
Adjusted depreciation of revenue earning vehicles and lease charges
$
483
$
528
Average Vehicles
654,514
627,300
Adjusted depreciation of revenue earning vehicles and lease charges divided by Average Vehicles (in whole dollars)
$
738
$
842
Number of months in period
3
3
Depreciation Per Unit Per Month (in whole dollars)
$
246
$
281
(12)
%
Note: Worldwide Rental Car represents U.S. Rental Car and International Rental Car segment information on a combined basis and excludes the All Other Operations segment, which is primarily comprised of the Company’s Donlen leasing operations, and Corporate.
(a) Based on December 31, 2018 foreign exchange rates.
(b) Calculated as Transaction Days divided by Available Car Days.
NON-GAAP MEASURES AND KEY METRICS – DEFINITIONS AND USE
Hertz Global is the top-level holding company and The Hertz Corporation is Hertz Global’s primary operating company (together, the "Company"). The term "GAAP" refers to accounting principles generally accepted in the United States of America.
Definitions of non-GAAP measures and key metrics are set forth below. Also set forth below is a summary of the reasons why management of the Company believes that the presentation of the non-GAAP financial measures included in the earnings release provide useful information regarding the Company’s financial condition and results of operations and additional purposes for which management of the Company utilizes the non-GAAP measures. Non-GAAP measures should not be considered in isolation and should not be considered superior to, or a substitute for, financial measures calculated in accordance with GAAP.
NON-GAAP MEASURES
Adjusted Pre-tax Income (Loss) and Adjusted Pre-tax Margin
Adjusted Pre-tax Income (Loss) is calculated as income (loss) before income taxes plus non-cash acquisition accounting charges, debt-related charges relating to the amortization and write-off of debt financing costs and debt discounts and premiums, goodwill, intangible and tangible asset impairments and write-downs, information technology and finance transformation costs, net income or loss attributable to noncontrolling interests and certain other miscellaneous or non-recurring items. Adjusted Pre-tax Income (Loss) is important to management because it allows management to assess operational performance of the Company’s business, exclusive of the items mentioned above. It also allows management to assess the performance of the entire business on the same basis as the segment measure of profitability. Management believes it is important to investors for the same reasons it is important to management and because it allows them to assess the operational performance of the Company on the same basis that management uses internally. When evaluating the Company’s operating performance, investors should not consider Adjusted Pre-tax Income (Loss) in isolation of, or as a substitute for, measures of the Company’s financial performance, such as net income (loss) or income (loss) before income taxes. Adjusted Pre-tax Margin is Adjusted Pre-tax Income (Loss) divided by total revenues.
Adjusted Net Income (Loss)
Adjusted Net Income (Loss) is calculated as Adjusted Pre-tax Income (Loss) less a provision for income taxes derived utilizing a combined statutory rate. The combined statutory rate is management’s estimate of the Company’s long-term tax rate. Adjusted Net Income (Loss) is important to management and investors because it represents the Company’s operational performance exclusive of the effects of purchase accounting, debt-related charges, net income or loss attributable to noncontrolling interests and certain other miscellaneous or non-recurring items that are not operational in nature or comparable to those of the Company’s competitors.
Adjusted Diluted Earnings (Loss) Per Share ("Adjusted Diluted EPS")
Adjusted Diluted EPS is calculated as Adjusted Net Income (Loss) divided by the weighted average number of diluted shares outstanding for the period. Adjusted Diluted EPS is important to management and investors because it represents a measure of the Company’s operational performance exclusive of the effects of purchase accounting adjustments, debt-related charges, income or loss attributable to noncontrolling interests and certain other miscellaneous or non-recurring items that are not operational in nature or comparable to those of the Company’s competitors.
Adjusted Free Cash Flow
Adjusted Free Cash Flow is calculated as net cash provided by operating activities, including the change in restricted cash and cash equivalents related to vehicles, net revenue earning vehicle and capital asset expenditures and the net impact of vehicle financing activities. Adjusted Free Cash Flow is important to management and investors as it provides useful information about the amount of cash available for acquisitions and the reduction of non-vehicle debt. When evaluating the Company’s liquidity, investors should not consider Adjusted Free Cash Flow in isolation of, or as a substitute for, a measure of the Company’s liquidity as determined in accordance with GAAP, such as net cash provided by operating activities.
Earnings Before Interest, Taxes, Depreciation and Amortization ("Gross EBITDA"), Corporate EBITDA, Adjusted Corporate EBITDA and Adjusted Corporate EBITDA Margin
Gross EBITDA is defined as net income (loss) before net interest expense, income taxes and depreciation (which includes lease charges on revenue earning vehicles) and amortization. Corporate EBITDA, as presented herein, represents Gross EBITDA as adjusted for vehicle debt interest, vehicle depreciation and vehicle debt-related charges. Adjusted Corporate EBITDA, as presented herein, represents Corporate EBITDA as adjusted for income or loss attributable to noncontrolling interests and certain other miscellaneous or non-recurring items, as described in more detail in the accompanying schedules.
Management uses Gross EBITDA, Corporate EBITDA and Adjusted Corporate EBITDA as operating performance metrics for internal monitoring and planning purposes, including the preparation of the Company’s annual operating budget and monthly operating reviews, as well as to facilitate analysis of investment decisions, profitability and performance trends. Further, Gross EBITDA enables management and investors to isolate the effects on profitability of operating metrics such as revenue, direct vehicle and operating expenses and selling, general and administrative expenses, which enables management and investors to evaluate the Company’s business segments that are financed differently and have different depreciation characteristics and compare the Company’s performance against companies with different capital structures and depreciation policies. We also present Adjusted Corporate EBITDA as a supplemental measure because such information is utilized in the determination of certain executive compensation.
Adjusted Corporate EBITDA Margin is calculated as the ratio of Adjusted Corporate EBITDA to total revenues and is used by the Company’s management as an additional measurement of operating profitability and operating performance trends.
Gross EBITDA, Corporate EBITDA, Adjusted Corporate EBITDA and Adjusted Corporate EBITDA Margin are not recognized measurements under GAAP. When evaluating the Company’s operating performance, investors should not consider Gross EBITDA, Corporate EBITDA and Adjusted Corporate EBITDA in isolation of, or as a substitute for, measures of the Company’s financial performance as determined in accordance with GAAP, such as net income (loss) or income (loss) before income taxes.
Fleet Growth
Fleet Growth is defined as revenue earning vehicles expenditures, net of proceeds from disposals, plus vehicle depreciation and net vehicle financing which includes borrowings, repayments and the change in restricted cash associated with vehicles. Fleet Growth is important as it allows the Company to assess the cash flow required to support its investment in revenue earning vehicles.
Net Non-vehicle Debt
Net Non-vehicle Debt is calculated as non-vehicle debt as reported on the Company’s balance sheet, excluding the impact of unamortized debt issue costs associated with non-vehicle debt, less cash and cash equivalents. Non-vehicle debt consists of the Company’s Senior Term Loan, Senior RCF, Senior Notes, Senior Second Priority Secured Notes, Promissory Notes and certain other non-vehicle indebtedness of its domestic and foreign subsidiaries. Net Non-vehicle Debt is important to management and investors as it helps measure the Company’s corporate leverage. Net Non-vehicle Debt also assists in the evaluation of the Company’s ability to service its non-vehicle debt without reference to the expense associated with the vehicle debt, which is collateralized by assets not available to lenders under the non-vehicle debt facilities.
Net Vehicle Debt
Net Vehicle Debt is calculated as vehicle debt as reported on the Company’s balance sheet, excluding the impact of unamortized debt issue costs associated with vehicle debt, less restricted cash associated with vehicles. Restricted cash associated with vehicle debt is restricted for the purchase of revenue earning vehicles and other specified uses under the Company’s vehicle debt facilities and its vehicle rental like-kind exchange program. Net Vehicle Debt is important to management, investors and ratings agencies as it helps measure the Company’s leverage with respect to its vehicle assets.
Total Net Debt
Total Net Debt is calculated as total debt, excluding the impact of unamortized debt issue costs, less total cash and cash equivalents and restricted cash associated with vehicle debt. Unamortized debt issue costs are required to be reported as a deduction from the carrying amount of the related debt obligation under GAAP. Management believes that eliminating the effects that these costs have on debt will more accurately reflect the Company’s net debt position. Total Net Debt is important to management, investors and ratings agencies as it helps measure the Company’s gross leverage.
KEY METRICS
Available Car Days
Available Car Days is calculated as Average Vehicles multiplied by the number of days in a period.
Average Vehicles ("Fleet Capacity" or "Capacity")
Average Vehicles is determined using a simple average of the number of vehicles in the fleet whether owned or leased by the Company at the beginning and end of a given period. Among other things, Average Vehicles is used to calculate Vehicle Utilization which represents the portion of the Company’s vehicles that are being utilized to generate revenue.
Depreciation Per Unit Per Month
Depreciation Per Unit Per Month represents the amount of average depreciation expense and lease charges per vehicle per month and is calculated as depreciation of revenue earning vehicles and lease charges, with all periods adjusted to eliminate the effect of fluctuations in foreign currency exchange rates, divided by the Average Vehicles in each period and then dividing by the number of months in the period reported. Management believes eliminating the effect of fluctuations in foreign currency exchange rates is appropriate so as not to affect the comparability of underlying trends. This metric is important to management and investors as it is reflective of how the Company is managing the costs of its vehicles and facilitates in comparison with other participants in the vehicle rental industry.
Time and Mileage Revenue Per Transaction Day ("Time and Mileage pricing" or "T&M Rate")
Time and Mileage ("T&M") pricing is calculated as Total Rental Revenue less ancillary revenue from value-added services, such as charges to the customer for the fueling of vehicles, loss damage waivers, insurance products, supplemental equipment and other consumables, divided by the total number of Transaction Days. This metric is important to management and investors as it represents a measurement of the changes in base rental fees, which comprise the majority of the Company’s Total RPD.
Total Rental Revenue
Total Rental Revenue is calculated as total revenue less ancillary retail vehicle sales revenue, with all periods adjusted to eliminate the effect of fluctuations in foreign currency exchange rates. Management believes eliminating the effect of fluctuations in foreign currency exchange rates is appropriate so as not to affect the comparability of underlying trends.
Total Revenue Per Transaction Day ("Total RPD"or "RPD"; also referred to as "pricing")
Total RPD is calculated as Total Rental Revenue divided by the total number of Transaction Days. This metric is important to management and investors as it represents a measurement of the changes in underlying pricing in the vehicle rental business and encompasses the elements in vehicle rental pricing that management has the ability to control.
Total Revenue Per Unit Per Month ("Total RPU" or "Total RPU Per Month")
Total RPU Per Month is calculated as Total Rental Revenue divided by the Average Vehicles in each period and then dividing by the number of months in the period reported. This metric is important to management and investors as it provides a measure of revenue productivity relative to fleet capacity, or asset efficiency.
Transaction Days ("Days"; also referred to as "volume")
Transaction Days, also known as volume, represent the total number of 24-hour periods, with any partial period counted as one Transaction Day, that vehicles were on rent (the period between when a rental contract is opened and closed) in a given period. Thus, it is possible for a vehicle to attain more than one Transaction Day in a 24-hour period. This metric is important to management and investors as it represents the number of revenue generating days.
Vehicle Utilization ("Utilization")
Vehicle Utilization is calculated by dividing Transaction Days by Available Car Days. This metric is important to management and investors as it is the measurement of the proportion of vehicles that are being used to generate revenues relative to fleet capacity.
ESTERO, Fla., April 30, 2019 /PRNewswire/ — In a continued effort to bring the latest technology and the best customer service, Hertz is introducing a refreshed app, which offers travelers a faster and more personalized rental experience with easy access to reservations, rewards and receipts.
New Hertz app offers a booking and rental experience that’s faster and more personalized.
Results from a recent J.D. Power Survey showed travel app users are craving user-friendly apps that allow for a seamless travel experience. Thanks to recent technology enhancements from Hertz, including new features available in its redesigned app, travelers can enjoy a faster and more personalized rental experience.
"When redesigning the Hertz app, we listened to customers and what they wanted most," said Hertz Senior Vice President, Brand Jayesh Patel. "Our customers told us they wanted faster reservations, better visibility to their loyalty program rewards and easy access to their rental history and receipts. The updated Hertz app offers those solutions and many more, representing our continued effort to advance our capabilities for a great customer experience."
The new app is the latest advancement from Hertz, following the recent Hertz Fast Lane powered by CLEAR announcement, which helps get customers on the road faster.
New features within the Hertz app include:
Faster and Easier Rentals – Travelers can quickly login to the app with facial recognition or Touch ID, access past rental searches for easier booking, and view current rentals and modify future reservations.
Better Rewards and Profile Management – Hertz Gold Plus Rewards® members can now view their member number, status and point balance in one view, pay for reservations with points or exchange points faster. Members can also modify their profile, preferences and payment options, as well as review their rental history and receipts for easy expense reporting. Additionally, the Hertz app makes it faster than ever to sign up for a Hertz Gold Plus Rewards membership.
Enhanced Access – Travelers can find nearby Hertz locations, including location info and driving directions, quickly contact customer support or Emergency Roadside Assistance, and find available parking through SpotHero®.
These enhanced features open the door to a faster and more rewarding car rental experience. The recent updates are one of many ways that Hertz plans to continue offering a booking and rental experience that is faster and more personalized.
The new Hertz app is available to download on Apple and Android devices in the U.S and Canada. To learn more, watch this short video or visit www.Hertz.com/app.
ABOUT HERTZ The Hertz Corporation, a subsidiary of Hertz Global Holdings, Inc., operates the Hertz, Dollar and Thrifty vehicle rental brands in approximately 10,200 company-owned, licensee and franchisee locations throughout North America, Europe, The Caribbean, Latin America, Africa, the Middle East, Asia, Australia and New Zealand. The Hertz Corporation is one of the largest worldwide rental companies, and the Hertz brand is one of the most recognized in the world. Product and service initiatives such as Hertz Gold Plus Rewards, Ultimate Choice, Carfirmations, Mobile Wi-Fi and unique vehicles offered through its specialty collections set Hertz apart from the competition. Additionally, The Hertz Corporation owns the vehicle leasing and fleet management leader Donlen, operates the Firefly vehicle rental brand and Hertz 24/7 car sharing business in international markets, and sells vehicles through Hertz Car Sales. For more information about The Hertz Corporation, visit: www.hertz.com.
ESTERO, Fla., April 10, 2019 /PRNewswire/ — Hertz Global Holdings, Inc. (NYSE: HTZ) announced today that it plans to report its first quarter 2019 financial results at approximately 4:00 p.m. ET on Monday, May 6 and will host its accompanying webcast and conference call to discuss such results on Tuesday, May 7 at 8:30 a.m. ET.
This webcast and conference call can be accessed through a link on the Investor Relations section of the Hertz website, ir.hertz.com, or by dialing (800) 230-1085 and providing passcode 466474. Investors are encouraged to dial-in approximately 10 minutes prior to the call. A web replay will remain available for approximately one year. A telephone replay will be available one hour following the conclusion of the call for one year at (800) 475-6701 with pass code 466474.
ABOUT HERTZ
The Hertz Corporation, a subsidiary of Hertz Global Holdings, Inc., operates the Hertz, Dollar and Thrifty vehicle rental brands in approximately 10,200 corporate and franchisee locations throughout North America, Europe, the Caribbean, Latin America, Africa, the Middle East, Asia, Australia and New Zealand. The Hertz Corporation is one of the largest worldwide vehicle rental companies, and the Hertz brand is one of the most recognized globally. Product and service initiatives such as Hertz Gold Plus Rewards, Ultimate Choice, Carfirmations, Mobile Wi-Fi and unique vehicles offered through its specialty collections set Hertz apart from the competition. Additionally, The Hertz Corporation owns the vehicle leasing and fleet management leader Donlen Corporation, operates the Firefly vehicle rental brand and Hertz 24/7 car sharing business in international markets and sells vehicles through Hertz Car Sales. For more information about The Hertz Corporation, visit: www.hertz.com.
LONDON, April 5, 2019 /PRNewswire/ — Hertz Europe, part of Hertz Global Holdings, Inc. (NYSE:HTZ), has launched The British Collection in the UK, offering a new high-end customer service experience, with a package of Best-of-British services and products – and a personalized welcome service.
The new premium collection features Land Rover and Jaguar luxury cars for rental, British-themed lounges, and a suite of extras – including pick-up options, additional driver and unlimited mileage to enhance the experience.
The launch of The British Collection at Hertz Marble Arch (London, UK) featuring best-of-British brands and service – with a range of Land Rover and Jaguar luxury models.
The British Collection is designed to offer an end-to-end premium service, bringing together The Best of British with a host of extras included – to pamper customers and smooth the journey.
Models available for hire include the Land Rover Discovery Sport and the Jaguar F Pace, E Pace, XE and XF, from the Hertz locations at London Heathrow Airport, Marble Arch, and Edinburgh Airport – with free additional driver, and unlimited mileage included in the rates. For added convenience, airport terminal delivery and collection is also part of the package for Heathrow and Edinburgh rentals – and local pick up and drop off for Marble Arch. The three locations will offer a "dedicated lounge" for a premium experience.
As part of the new collection, customers can relax in a dedicated lounge featuring "Best of British" furnishings from the interior design company, Tom Dixon, and enjoy a refreshing ‘botanical’ drink from Seedlip, the world’s first non-alcoholic spirits brand: an ideal choice for nominated drivers and passengers alike.
Hertz has also commissioned premier London Florist, McQueens, to curate a unique in-lounge garden experience, featuring a selection of plants and flowers from across the UK, to recreate the feel of a classic British country garden. To complete the experience, Hertz worked with British artist Lauren Baker to develop a new neon light installation to launch The British Collection, signifying the union of modern and premium brands from the UK.
The unveiling of The British Collection follows the successful launch of the premium "Selezione Italia" range in Italy last year.
Richard Davies, Country Manager for Hertz UK, says: "The unveiling of The British Collection and dedicated lounges represents Hertz’s continuing commitment to providing its customers with unique and exclusive tailored experiences. The British Collection is a new, upmarket offering, built with creativity and luxury in mind. Working with premium British brands and talent, we’ve been able to build an adventure from branch to the road."
Notes to Editors
Customers choosing The British Collection will benefit from a make-and-model guarantee, meaning that the car booked is the one they drive away with. Customers will further benefit from the option of adding another driver to their booking and arranging local delivery and collection without any additional cost.
Bookings for The British Collection must be made directly on Hertz.com, where customers will benefit from Hertz’s best rate guarantee. Drivers must be aged 25 or above and present two credit cards. Further details, terms and conditions are available at hertz.co.uk/britishcollection.
All Gold Plus Rewards customers are entitled to Hertz Connect with a minimum spend of UK£ 250 (approximately US$ 329). Hertz Connect is a portable, hotspot device providing complimentary 4G Internet connection, free International calls of up to 30 minutes a day, translation tool, and city guides. The Gold Plus Rewards program is free to join, and allows members to earn rewards, enjoy special member discounts, and bypass counters at more than 50 of the world’s busiest airports.
About Hertz: The Hertz Corporation, a subsidiary of Hertz Global Holdings, Inc., operates the Hertz, Dollar, Thrifty and Firefly vehicle rental brands in approximately 10,200 corporate and franchise locations throughout North America, Europe, The Caribbean, Latin America, Africa, the Middle East, Asia, Australia and New Zealand. The Hertz Corporation is one of the largest worldwide rental companies, and the Hertz brand is one of the most recognized in the world. Product and service initiatives such as Hertz Gold Plus Rewards, Ultimate Choice, Carfirmations, Mobile Wi-Fi and unique vehicles offered through the Adrenaline, Dream, Green and Prestige Collections set Hertz apart from the competition. Additionally, The Hertz Corporation owns the vehicle leasing and fleet management leader Donlen, operates the Hertz 24/7 car sharing business in international markets, and sells vehicles through Hertz Car Sales. For more information about The Hertz Corporation, visit: www.hertz.com.
ESTERO, Fla., April 1, 2019 /PRNewswire/ — For the eighth consecutive year, the Hertz Gold Plus Rewards® program swept the 2019 FlyerTalk Awards, consumer-selected awards for travel loyalty programs, in the Drive category across the Americas, Europe/Africa and Middle East/Asia/Oceana. FlyerTalk also recognized Hertz Gold Plus Rewards for Outstanding Benefit for the following member benefits: Hertz Ultimate Choice (Americas), Five Star and President’s Circle (Europe/Africa) and Platinum Elite service (Middle East/Asia/Oceana).
2019 FlyerTalk Awards Name Hertz as Winner for Eighth Consecutive Year
The FlyerTalk Awards are determined by FlyerTalk, an online community of more than 700,000 frequent travelers. FlyerTalk members are dedicated to finding and sharing elite-level knowledge of airline, hotel and car rental affinity programs, voting once a year for the best ones within the Fly, Stay and Drive categories.
For the past eight years, the FlyerTalk Awards have underscored Hertz’s longstanding legacy of speed, innovation and superior service. Hertz is committed to enhancing the entire customer experience getting travelers on their way quickly in the car that’s right for them.
"We are honored to see the Hertz Gold Plus Rewards program continually recognized by the FlyerTalk community as the number one car rental loyalty program worldwide," said Hertz Senior Vice President, Brand Jayesh Patel. "To ensure the program remains the best in the industry, we continue to add rewarding technology-driven and innovative offerings such as Hertz Fast Lane powered by CLEAR® that set a new standard for fast and seamless travel."
Hertz Gold Plus Rewards opens the door to a faster and more rewarding car rental experience. Members can quickly reserve a car on Hertz.com or the Hertz mobile app, skip the line, choose from a variety of vehicles and enjoy faster checkout and returns. Additional benefits include:
Hertz Fast Lane powered by CLEAR®: Gold Plus Rewards members can get on the road faster. CLEAR uses just your face to confirm it’s really you. This means less time reaching for your driver’s license and more time at your destination. Hertz Fast Lane powered by CLEAR is free to enroll and debuted at Hartsfield-Jackson Atlanta International Airport and will expand to select U.S. Hertz airport locations throughout 2019.
Access to exclusive experiences: In addition to earning points for free rental days or in exchange for frequent traveler program rewards with leading airline and hotel partners, members can bid on exclusive travel experiences with points via the Hertz Rewards online auction platform.
Hertz Ultimate Choice®: Members can select the vehicle they want to drive from Hertz’s best fleet ever, which includes a range of premium and luxury vehicles equipped with the latest technology features. Ultimate Choice is currently available in more than 55 top airport Hertz locations in the U.S. and Canada.
Increased bonus points: Members can achieve elite status and receive bonus opportunities and complimentary upgrades to premium vehicles. Members with 12 or more rentals per year can earn Hertz Five Star® status and a 25 percent bonus. Hertz President’s Circle® status can be earned with 20 or more rentals annually with a 50 percent bonus.
For more information about Hertz Gold Plus Rewards, and to sign up today for free, visit Hertz.com/goldplusrewards.
ABOUT HERTZ
The Hertz Corporation, a subsidiary of Hertz Global Holdings, Inc., operates the Hertz, Dollar, Thrifty and Firefly vehicle rental brands in approximately 10,200 corporate and franchisee locations throughout North America, Europe, The Caribbean, Latin America, Africa, the Middle East, Asia, Australia and New Zealand. The Hertz Corporation is one of the largest worldwide rental companies, and the Hertz brand is one of the most recognized in the world. Product and service initiatives such as Hertz Gold Plus Rewards, Ultimate Choice, Carfirmations, Mobile Wi-Fi and unique vehicles offered through the Adrenaline, Dream, Green and Prestige Collections set Hertz apart from the competition. Additionally, The Hertz Corporation owns the vehicle leasing and fleet management leader Donlen, operates the Hertz 24/7 car sharing business in international markets, and sells vehicles through Hertz Car Sales. For more information about The Hertz Corporation, visit: www.hertz.com.