Hertz Global Holdings, Inc. to Announce Second Quarter 2026 Financial Results on August 6, 2026
Hertz Global Holdings, Inc. (NASDAQ: HTZ) (the “Company”) announced today that it plans to report its second quarter 2026 financial results at 8:00 a.m. ET on Thursday, August 6, 2026.
July 14, 2026
Latest News
Hertz Data Reveals Surge in Match-Driven Road Trips as Global Soccer Fans Redefine U.S. Travel
As global soccer fans travel to the United States this summer, new Hertz data reveals a breakout travel trend: fans aren’t just flying in for matches, they’re hitting the road and turning the tournament into a multi-city, classic American road trip experience.
June 30, 2026
Press Release
Hertz Announces Completion of $350 Million of Exchangeable Senior First-Lien Secured PIK Notes
June 29, 2026
Press Release
Hertz Announces Pricing of Offering of 37,037,037 Shares of Common Stock
June 25, 2026
Press Release
Hertz Announces Pricing of Upsized $350 Million of Exchangeable Senior First-Lien Secured PIK Notes
June 25, 2026
Press Release
Hertz Announces Proposed Offering of $100 Million of Common Stock
June 24, 2026
Press Release
Hertz Announces Proposed Offering of $300 Million of Exchangeable Senior First-Lien Secured PIK Notes
June 24, 2026
Press Release
New Hertz Data Highlights Summer Travel Momentum Ahead of July Fourth
June 18, 2026
Press Release
New Hertz Data Signals a Road Trip Renaissance, as 64% of Americans Plan to Hit the Road this Summer
Memorial Day weekend marks the unofficial start of summer travel season, and a new survey from Hertz shows Americans are doubling down on car travel, with 64% planning a road trip this summer. This resurgence reflects a growing desire to reclaim the road trip as an antidote to modern travel stress, embracing the freedom, flexibility and sense of control that driving brings to summer travel. As the country approaches its 250th anniversary, travelers are choosing iconic highways, scenic drives and experience-led itineraries as they rediscover the country through the open road.
May 12, 2026
Press Release
Hertz Announces Q1 2026 Results, Strongest Revenue Growth in Three Years
Hertz Global Holdings, Inc. (NASDAQ: HTZ) (“Hertz,” “Hertz Global,” or the “Company”) today reported results for its first quarter 2026.
May 7, 2026
Press Release
Aeroplan Announces New Partnership With Hertz
Aeroplan, Canada’s leading travel loyalty program, has announced a new strategic partnership with Hertz, one of the world’s largest vehicle rental companies. This collaboration extends across Hertz, Dollar, and Thrifty, and is the latest example of Aeroplan’s commitment to expanding its partner ecosystem, providing members with more opportunities to earn rewards, unlock premium benefits, and accelerate their journey to Aeroplan Elite Status.
May 6, 2026
Press Release
Hertz Car Sales Continues Retail Expansion with Digital Showroom on eBay
Hertz Car Sales today announced the latest strategic expansion of its digital retail presence with eBay, bringing thousands of Hertz Certified, near-new vehicles to one of the world’s largest online automotive marketplaces. Through a dedicated Hertz Car Sales showroom, shoppers on eBay will have access to more than 8,000 vehicle listings, enjoying greater confidence, convenience, and value backed by a trusted brand.
May 5, 2026
Press Release
Hertz and The Home Depot Partner to Honor Military Heroes
As the nation looks ahead to its 250th anniversary and observes Military Appreciation Month, Hertz and The Home Depot – are coming together to honor military heroes with a nationwide initiative designed to support their everyday needs with reliable transportation, special travel benefits and meaningful upgrades at home.
May 1, 2026
Press Release
Hertz and Uber Partner to Power Autonomous Robotaxi and Driver-Led Fleet Operations
Hertz Global Holdings, Inc.’s (NASDAQ: HTZ) affiliated operating company, Oro Mobility, and Uber Technologies, Inc. (NYSE: UBER) today announced two strategic fleet partnerships, accelerating Hertz’s growth into new mobility vectors and advancing Uber’s autonomous robotaxi and driver-led strategic fleet services.
April 30, 2026
Latest News
Cox Automotive Research Reveals the Tax Season Affordability Gap – and Why Hertz Car Sales Has the Answer
Tax season is bringing high-intent car buyers to market, but a widening gap between what shoppers want and what they can afford is reshaping purchase decisions in 2026. New data from Cox Automotive shows that more than half of refund-driven buyers are purchasing out of necessity, and most expect to spend well below today’s average new car price of nearly $50,000. Hertz Car Sales is meeting that moment with the largest selection of near-new, model year 2025 vehicles in the U.S. used retail market – priced on average at more than half the cost of buying new.
April 14, 2026
Press Release
Hertz Global Holdings, Inc. to Announce First Quarter 2026 Financial Results on May 7, 2026
Hertz Global Holdings, Inc. announced today that it plans to report its first quarter 2026 financial results at 8:00 a.m. ET on Thursday, May 7, 2026.
April 6, 2026
Latest News
Hertz Reveals 2026 U.S. Spring Travel Trends
New Hertz travel insights reveal how spring break travel is shifting, with travelers embracing more flexible timing and longer windows for their getaways.
April 1, 2026
Latest News
Hertz Reports Jump in Search Traffic as Long TSA Lines Disrupt Travel
For travelers missing or delaying vacations because of long TSA lines, Hertz has a solution to stay in control of travel plans: get in the car and go.
March 26, 2026
Press Release
Hertz Expands Premium Fleet with INEOS Grenadier
Hertz, one of the world’s largest rental car companies, today announced the addition of the INEOS Grenadier to its U.S. rental fleet, further expanding the lineup of premium vehicles available to customers.
March 18, 2026
Press Release
Hertz Transformation Drives Structural Revenue Gains and Builds Sustainable Momentum
Hertz Global Holdings, Inc. (NASDAQ: HTZ) (“Hertz,” “Hertz Global,” or the “Company”) today reported results for its fourth quarter and full year 2025.
February 26, 2026
Press Release
Hertz Showcases Employee Car Culture and New 2026 Fleet at Estero Headquarters
Hertz hosted its second annual Employee Car Show and Meet the Fleet event today at the company’s global headquarters in Estero, where cars of all eras took center stage. The event celebrated employees’ passion for vehicles while offering an exclusive look at the new models joining the company’s 2026 rental fleet.
February 19, 2026
Press Release
Thousands of Golden Retrievers to Gather in Golden, Colo. for Goldens in Golden, February 7, 2026
Hertz Gold Squad joins as first-ever presenting sponsor; beloved event to debut dog-friendly shuttles, new programming, and major enhancements
February 2, 2026
Press Release
Hertz Global Holdings, Inc. to Announce Fourth Quarter and Full Year 2025 Financial Results on February 26, 2026
Hertz Global Holdings, Inc. to Announce Fourth Quarter and Full Year 2025 Financial Results on February 26, 2026
February 2, 2026
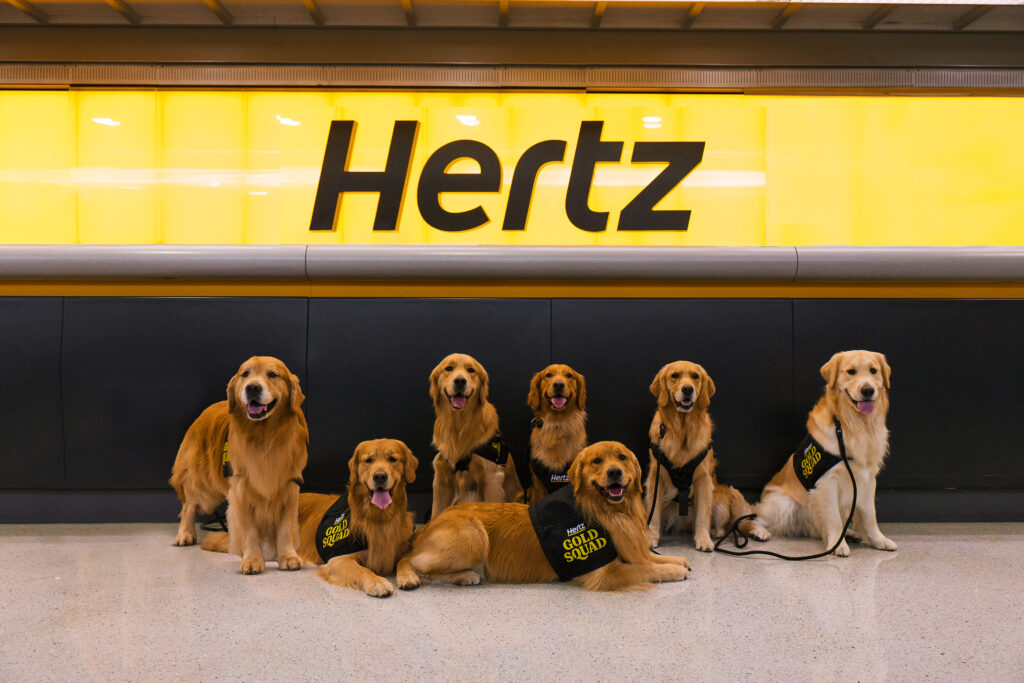
Hertz Makes Holiday Travel Golden with Gold Squad’s Final 2025 Stop at Newark Airport
After debuting its nationwide Hertz Gold Squad program earlier this year, Hertz is bringing its beloved team of highly-trained Golden Retrievers to Newark Liberty International Airport for their final 2025 appearance with plans to continue spreading joy into 2026. As millions of Americans hit the road for what is expected to be one of the busiest holiday travel seasons in years, the Gold Squad will greet travelers with comfort, joy, and surprise perks during peak December travel days.
December 18, 2025
Hertz Joins Airlines, Calls for End to Government Shutdown
Hertz Global Holdings, Inc. (NASDAQ: HTZ) (“Hertz,” “Hertz Global,” or the “Company”) today released a new statement from Gil West, Chief Executive Officer.
November 6, 2025
Hertz Transformation Drives Record Utilization and Return to EPS Profitability
Hertz Global Holdings, Inc. (NASDAQ: HTZ) today reported results for its third quarter 2025.
November 4, 2025
Hertz announces New Franchise Partnership in Singapore
Ace Drive Pte Ltd, part of Reach Group, appointed as the official Hertz and Thrifty franchisee in Singapore. The partnership reinforces Hertz’s expansion strategy across Asia-Pacific.
October 30, 2025
Hertz Appoints Piero Bussani as Chief Legal Officer
Hertz Global Holdings, Inc. (NASDAQ: HTZ) (“Hertz” or the “Company”), a leading global car rental company, today announced that Piero Bussani is joining the company as Executive Vice President and Chief Legal Officer, effective October 27, to lead global legal affairs, government affairs and sustainability and social impact.
October 22, 2025
Hertz Promotes Mike Moore to Chief Operating Officer
Hertz Global Holdings, Inc. (NASDAQ: HTZ) (“Hertz” or the “Company”), a leading global car rental company, today announced that Mike Moore has been promoted to Executive Vice President and Chief Operating Officer with direct, end-to-end responsibility for all fleet operations.
October 3, 2025
Hertz Car Sales Launches Online Car Buying
Hertz Car Sales, which offers one of the largest selections of high-quality used vehicles direct to consumers, today announced the launch of a fully online car-buying experience at HertzCarSales.com. Shoppers nationwide can now browse, finance, and purchase vehicles entirely online, gaining greater confidence, transparency, and convenience through the enhanced digital platform.
September 30, 2025
Hertz Announces Completion of $425 Million Exchangeable Senior Notes Offering
Hertz Announces Completion of $425 Million Exchangeable Senior Notes Offering
September 29, 2025
Hertz Announces Pricing of Upsized $375 Million Exchangeable Senior Notes Offering
Hertz Announces Pricing of Upsized $375 Million Exchangeable Senior Notes Offering
September 25, 2025
Hertz Announces $250 Million Exchangeable Senior Notes Offering
Hertz Announces $250 Million Exchangeable Senior Notes Offering
September 24, 2025
Hertz Puts Fans in the Driver’s Seat at Lone Star Le Mans
As the World Endurance Championship (WEC) makes its only U.S. stop at Austin’s Circuit of the Americas (COTA) on Sunday, Sept. 7, Hertz, together with Cadillac Hertz Team JOTA, is bringing fans an action packed weekend of racing, interactive competition, and exclusive experiences that showcase the excitement of endurance racing like never before.
September 4, 2025
Hertz Global Holdings, Inc. to Announce Third Quarter 2025 Financial Results on November 4, 2025
Hertz Global Holdings, Inc. (NASDAQ: HTZ) (the “Company”) announced today that it plans to report its third quarter 2025 financial results at 8:00 a.m. ET on Tuesday, November 4, 2025, followed by an earnings call at 9:00 a.m. ET.
August 28, 2025
Hertz Brings Golden Retriever ‘Gold Squad’ to Airports Nationwide
Estero, Fla., Aug. 25, 2025 – As the busy Labor Day weekend approaches, Hertz, one of the world’s largest car rental companies, is seeking to comfort stressed travelers. With a mission to make travelers feel golden, Hertz is bringing its ‘Gold Squad’ – a team of highly trained Golden Retrievers – to select airports across the country. These friendly, furry ambassadors aim to bring comfort, calm and cuddles during peak travel times, ensuring all Hertz customers hit the road with a smile.
August 25, 2025
Hertz Car Sales Launches on Amazon Autos
ESTERO, FLA. – August 20, 2025 – Hertz Car Sales has joined Amazon Autos allowing shoppers to browse, finance, and purchase from a selection of thousands of high-quality pre-owned vehicles. This strategic collaboration brings together Hertz Car Sales’ trusted nationwide inventory with the convenience of Amazon’s shopping and checkout experience.
August 20, 2025
Hertz Car Sales is Redefining the Test Drive and Expanding its Rent2Buy Program to 100+ Cities Nationwide
Hertz Car Sales today announced the nationwide expansion of its popular Hertz Rent2Buy® program to more than 100 cities. As consumers increasingly embrace the “try before you buy” approach—from furniture to fashion—Hertz Car Sales is meeting the moment by redefining the traditional test drive. The Rent2Buy program offers thousands of well-maintained, competitively priced used vehicles—including newly added 2025 models—for an extended test drive.
August 14, 2025
Hertz Logs Best Quarterly Results In Nearly Two Years, Driven by Half a Billion Dollar Profitability Improvement
Hertz reported results for its second quarter 2025, delivering positive Adjusted Corporate EBITDA and improvements in other key metrics.
August 7, 2025
Hertz to Sponsor John Hunter Nemechek and the No. 42 LEGACY MOTOR CLUB Toyota at Dover
STATESVILLE, N.C. (July 8, 2025) – LEGACY MOTOR CLUB announced today that Hertz, one of the world’s largest mobility solutions providers, will serve as the primary sponsor of John Hunter Nemechek’s No. 42 Toyota Camry XSE for the NASCAR Cup Series race at Dover Motor Speedway on July 20. The announcement marks another chapter in the evolving partnership between LEGACY MOTOR CLUB and team co-owner Knighthead Capital Management, LLC, on behalf of its investors, which also co-owns Cadillac Hertz Team JOTA racing team in the FIA World Endurance Championship (“WEC”).
July 8, 2025
Hertz Global Holdings, Inc. to Announce Second Quarter 2025 Financial Results on August 7, 2025
ESTERO, Fla., May 23, 2025 /PRNewswire/ — Hertz Global Holdings, Inc. (NASDAQ: HTZ) (the “Company”) announced today that it plans to report its second quarter 2025 financial results at 8:00 a.m. ET on Thursday, August 7, 2025, followed by an earning…
May 23, 2025
It’s a (Hertz) Jeep® 4×4 Thing: Hertz Adds 2025 Jeep Wrangler to its Newest Fleet Yet
From giving a friendly Jeep® wave to showing kindness with rubber ducks, Hertz has everything drivers need to join the Jeep community and explore the open road like a Jeep 4×4 owner this summer
ESTERO, Fla., May 14, 2025 /PRNewswire/ — Hertz, one of…
May 14, 2025
HERTZ REPORTS SIGNIFICANT PROGRESS TOWARDS KEY MILESTONES FOR FIRST QUARTER 2025
“Our ‘Back-to-Basics Roadmap’ is working,” said Gil West, Chief Executive Officer of Hertz. “Disciplined fleet management, revenue optimization, and rigorous cost control are driving meaningful results. In a dynamic environment shaped by tariffs and …
May 12, 2025
Hertz Strengthens Financial Foundation Through Completion of Amended Credit Facilities
Extends $1.665 Billion of Commitments Under Revolving Credit Facility, $2.860 Billion of Commitments Under HVF III U.S. Vehicle Variable Funding Notes, and €1.160 Billion Under European ABS
ESTERO, Fla., May 9, 2025 /PRNewswire/ — Hertz Global Holdi…
May 9, 2025
Hertz and UVeye Partner to Modernize Vehicle Maintenance with AI Technology
Hertz, one of the world’s leading car rental companies, announced today that it is transforming its vehicle maintenance process by partnering with UVeye, a global leader in AI-driven vehicle inspection systems, to introduce advanced AI inspection to its U.S. operations.
April 16, 2025
Hertz Global Holdings, Inc. to Announce First Quarter 2025 Financial Results on May 12, 2025
ESTERO, Fla., April 15, 2025 /PRNewswire/ — Hertz Global Holdings, Inc. (NASDAQ: HTZ) (the “Company”) announced today that it plans to report its first quarter 2025 financial results after the market closes on Monday, May 12, 2025 and will host its …
April 15, 2025
Comedian and SNL Superstar Mikey Day Drops Travel Knowledge as ‘The Common Sensei’ in New Dollar Car Rental Ad Campaign
Day Offers Witty, No-Nonsense Tips to Simplify Travel & Car Rental
ESTERO, Fla., April 7, 2025 /PRNewswire/ — Dollar Car Rental, a leading rental car provider, is excited to announce the launch of its latest campaign featuring renowned comedian, imp…
April 7, 2025
Tom Brady Gets A New Job: Hertz Car Salesman
Brady Plays Used Car Salesman in New Hertz Ad Offering Chance to Win Cadillac XT5
ESTERO, Fla., March 4, 2025 /PRNewswire/ — Hertz, one of the world’s leading car rental companies, is teaming up with Tom Brady once again to share that Hertz is also …
March 4, 2025
HERTZ REPORTS FOURTH QUARTER AND FULL YEAR 2024 RESULTS
“Our focus in 2024 was stabilizing the business and implementing fundamental changes to transform our company,” said Gil West, Hertz CEO. “With our new leadership team and organizational structure in place, we are well positioned to execute our strat…
February 13, 2025
Hertz Global Holdings, Inc. to Announce Fourth Quarter and Full Year 2024 Financial Results on February 13, 2025
ESTERO, Fla., Jan. 2, 2025 /PRNewswire/ — Hertz Global Holdings, Inc. (NASDAQ: HTZ) (the “Company”) announced today that it plans to report its fourth quarter and full year 2024 financial results at 8:00 a.m. ET on Thursday, February 13, 2025, follo…
January 2, 2025
Hertz Strengthens Executive Team with Two Key Leadership Appointments
ESTERO, Fla., Dec. 30, 2024 /PRNewswire/ — Hertz Global Holdings, Inc. (NASDAQ: HTZ) – one of the leading global car rental companies – today announced two appointments to its leadership team, with Chris Berg joining the company as Executive Vice Pr…
December 30, 2024
Hertz Announces Receipt of Requisite Consents from Holders to Amend its 12.625% First Lien Senior Secured Notes Due 2029 and 8.000% Exchangeable Senior Second-Lien PIK Notes due 2029 and Expiration of Consent Solicitations
ESTERO, Fla., Dec. 13, 2024 /PRNewswire/ — Hertz Global Holdings, Inc. (NASDAQ: HTZ) (“Hertz” or the “Company”), a leading global rental car company, today announced that its wholly-owned indirect subsidiary, The Hertz Corporation (“Hertz Corp.”), r…
December 13, 2024
Hertz Announces Pricing of $500 Million of Additional First Lien Senior Secured Notes Offering
ESTERO, Fla., Dec. 5, 2024 /PRNewswire/ — Hertz Global Holdings, Inc. (NASDAQ: HTZ) (“Hertz” or the “Company”), a leading global rental car company, today announced that its wholly-owned indirect subsidiary, The Hertz Corporation (“Hertz Corp.”), ha…
December 5, 2024
Hertz Announces Consent Solicitations to Amend its 12.625% First Lien Senior Secured Notes Due 2029 and 8.000% Exchangeable Senior Second-Lien PIK Notes due 2029
ESTERO, Fla., Dec. 5, 2024 /PRNewswire/ — Hertz Global Holdings, Inc. (NASDAQ: HTZ) (“Hertz” or the “Company”), a leading global rental car company, today announced that its wholly-owned indirect subsidiary, The Hertz Corporation (“Hertz Corp.”), wi…
December 5, 2024
Hertz Announces Offering of $500 Million of Additional First Lien Senior Secured Notes
ESTERO, Fla., Dec. 5, 2024 /PRNewswire/ — Hertz Global Holdings, Inc. (NASDAQ: HTZ) (“Hertz” or the “Company”), a leading global rental car company, today announced that its wholly-owned indirect subsidiary, The Hertz Corporation (“Hertz Corp.”), in…
December 5, 2024
HERTZ REPORTS THIRD QUARTER 2024 RESULTS
“In the third quarter, we continued executing on our efforts to implement our transformation, focusing on our back-to-basics strategy to deliver sustainable, long-term returns for shareholders,” said Gil West, Hertz CEO. “Our team’s commitment to bot…
November 12, 2024
Hertz Global Holdings, Inc. to Announce Third Quarter 2024 Financial Results on November 12, 2024
ESTERO, Fla., Nov. 4, 2024 /PRNewswire/ — Hertz Global Holdings, Inc. (NASDAQ: HTZ) (the “Company”) announced today that it plans to report its third quarter 2024 financial results at 8:00 a.m. ET on Tuesday, November 12, 2024, followed by an earnin…
November 4, 2024
Hertz Helps Drive the Vote this Election Day with One Free Rental Day with a Two+ Day Rental
ESTERO, Fla., Oct. 21, 2024 /PRNewswire/ —
Continue Reading
Hertz (PRNewsfoto/Hertz Global Holdings, Inc.)
What:
Today, Hertz (NASDAQ: HTZ) announced that it is helping citizens in communities across the nation get to the polls with its Free Day o…
October 21, 2024
Hertz Announces Lauren Fritts as Senior Vice President and Chief Communications Officer
ESTERO, Fla., Sept. 19, 2024 /PRNewswire/ — Hertz Global Holdings, Inc. (NASDAQ: HTZ) – one of the leading global car rental companies – today announced that Lauren Fritts will join the company as Senior Vice President and Chief Communications Offic…
September 19, 2024
Hertz Further Strengthens Board with 2 New Members
ESTERO, Fla., Aug. 27, 2024 /PRNewswire/ — Hertz Global Holdings, Inc. (NASDAQ: HTZ) – one of the leading global rental car companies – announced that its Board of Directors is increasing the size of the Board from nine to 11 and is electing Mr. Fra…
August 27, 2024
HERTZ REPORTS SECOND QUARTER 2024 RESULTS
“We’re moving quickly with a best-in-class leadership team, a strategy laser-focused on delivering sustainable returns and elevating our operational performance across the business,” said Gil West, Hertz CEO. “During the second quarter, we bolstered …
August 1, 2024
Hertz Strengthens Leadership Team with Key Executive Appointments
ESTERO, Fla., July 8, 2024 /PRNewswire/ — Hertz Global Holdings, Inc. (NASDAQ: HTZ) (“Hertz” or the “Company”), a leading global rental car company, today announced key appointments that will strengthen its leadership team and sharpen the Company’s …
July 8, 2024
Hertz Global Holdings, Inc. to Announce Second Quarter 2024 Financial Results on August 1st
ESTERO, Fla., July 1, 2024 /PRNewswire/ — Hertz Global Holdings, Inc. (NASDAQ: HTZ) (the “Company”) announced today that it plans to report its second quarter 2024 financial results at 8:00 a.m. ET on Thursday, August 1, 2024, followed by an earning…
July 1, 2024
Hertz Announces Upsize and Pricing of $1 Billion Offerings
Comprised of $750 Million of First Lien Senior Secured Notes and $250 Million of Exchangeable Senior Second-Lien Secured PIK Notes Issued by The Hertz Corporation
ESTERO, Fla., June 21, 2024 /PRNewswire/ — Hertz Global Holdings, Inc. (NASDAQ: HTZ) (…
June 21, 2024
Hertz Announces Committed Offerings Totaling $750 Million
Comprised of $500 Million of First Lien Senior Secured Notes and $250 Million of Exchangeable Senior Second-Lien Secured PIK Notes Issued by The Hertz Corporation
ESTERO, Fla., June 20, 2024 /PRNewswire/ — Hertz Global Holdings, Inc. (NASDAQ: HTZ) (…
June 20, 2024
Hertz Announces Appointment of Scott M. Haralson as Chief Financial Officer
ESTERO, Fla., June 3, 2024 /PRNewswire/ — Hertz Global Holdings, Inc. (NASDAQ: HTZ) (“Hertz”, “Hertz Global” or the “Company”), a leading global rental car company, today announced the appointment of Scott M. Haralson as Chief Financial Officer, joi…
June 3, 2024
HERTZ REPORTS FIRST QUARTER 2024 RESULTS
“Fleet and direct operating costs weighed on this quarter’s performance,” said Gil West, Hertz chief executive officer. “We’re tackling both issues – getting to the right supply of vehicles at an acceptable capital cost while at the same time driving…
April 25, 2024
Hertz Global Holdings, Inc. to Announce First Quarter 2024 Financial Results on April 25th
ESTERO, Fla., April 8, 2024 /PRNewswire/ — Hertz Global Holdings, Inc. (NASDAQ: HTZ) (the “Company”) announced today that it plans to report its first quarter 2024 financial results at approximately 7:30 a.m. ET on Thursday, April 25, 2024 followed …
April 8, 2024
Hertz Announces Appointment of Gil West as Chief Executive Officer as Stephen Scherr Steps Down as CEO of the Company
Transportation veteran to focus on operationally-driven revenue and EBITDA growth
ESTERO, Fla., March 15, 2024 /PRNewswire/ — Hertz Global Holdings, Inc. (NASDAQ: HTZ), a leading global rental car company, today announced that Gil West, former Chief…
March 15, 2024
HERTZ REPORTS FOURTH QUARTER AND FULL YEAR 2023 RESULTS
“Our business benefitted from solid demand and a stable rate environment in the fourth quarter,” said Stephen Scherr, Hertz chair and chief executive officer. “Nevertheless, we continued to face headwinds related to our electric vehicle fleet and oth…
February 6, 2024
Hertz Global Holdings, Inc. to Announce Fourth Quarter 2023 Financial Results on February 6th
ESTERO, Fla., Jan. 11, 2024 /PRNewswire/ — Hertz Global Holdings, Inc. (NASDAQ: HTZ) (the “Company”) announced today that it plans to report its fourth quarter 2023 financial results at approximately 7:30 a.m. ET on Tuesday February 6, 2024 followed…
January 11, 2024
Hertz Names Justin Keppy as Chief Operating Officer
ESTERO, Fla., Oct. 24, 2023 /PRNewswire/ — Hertz Global Holdings, Inc., (NASDAQ: HTZ), a global leader in car rental, today announced that Justin Keppy will join the company as Executive Vice President and Chief Operating Officer, effective November…
October 24, 2023
Hertz Global Holdings, Inc. to Announce Third Quarter 2023 Financial Results on October 26th
ESTERO, Fla., Oct. 3, 2023 /PRNewswire/ — Hertz Global Holdings, Inc. (NASDAQ: HTZ) (the “Company”) announced today that it plans to report its third quarter 2023 financial results at approximately 7:30 a.m. ET on Thursday, October 26, 2023 followed…
October 3, 2023
Hertz and Mayor Adams Launch “Hertz Electrifies New York City”
Mayor Adams Partners with Hertz to Add Electric Vehicles, Create Jobs, and Provide Workforce Training
NEW YORK, Sept. 20, 2023 /PRNewswire/ — During New York City Climate Week, Hertz (NASDAQ: HTZ) CEO Stephen Scherr and New York City Mayor Eric Adam…
September 20, 2023
Hertz Announces Departure of Paul Stone; Search For New Chief Operating Officer Underway
ESTERO, Fla., Sept. 13, 2023 /PRNewswire/ — Hertz Global Holdings, Inc. (Nasdaq: HTZ) today announced that Paul Stone, Chief Operations Officer and President, will step down from his role effective September 30, 2023, to pursue opportunities in the …
September 13, 2023
HERTZ REPORTS SECOND QUARTER 2023 RESULTS: REVENUE OF $2.4 BILLION, NET INCOME OF $139 MILLION AND ADJUSTED CORPORATE EBITDA OF $347 MILLION
“Results for the second quarter were strong, reflecting continued high demand for our services and elevated levels of fleet utilization,” said Stephen Scherr, Chair and CEO of Hertz. “Our focus on asset returns continues to yield tangible results, en…
July 27, 2023
Hertz Names Alexandra Brooks as Chief Financial Officer
Kelly Galloway appointed to Chief Accounting Officer
ESTERO, Fla., July 26, 2023 /PRNewswire/ — Hertz Global Holdings, Inc. (NASDAQ: HTZ) today announced that Alexandra Brooks, the company’s interim Chief Financial Officer since April 2023 and Chief…
July 26, 2023
Hertz Kicks Off One of the Country’s Largest EV Test Drives
ESTERO, Fla., July 19, 2023 /PRNewswire/ — Hertz is giving Americans the opportunity to experience an electric vehicle by hosting one of the largest-ever EV test drives in the country. Today, Hertz customers and rideshare drivers will have the chanc…
July 19, 2023
Hertz Global Holdings, Inc. to Announce Second Quarter 2023 Financial Results on July 27th
ESTERO, Fla., July 5, 2023 /PRNewswire/ — Hertz Global Holdings, Inc. (NASDAQ: HTZ) (the “Company”) announced today that it plans to report its second quarter 2023 financial results at approximately 7:30 a.m. ET on Thursday, July 27, 2023 followed b…
July 5, 2023
Tom Brady Reveals All in “Electrifying” New Hertz Ads Featuring Yvonne Orji
Hertz extends its partnership with the seven-time Super Bowl champion through 2024
ESTERO, Fla., May 22, 2023 /PRNewswire/ — Tom Brady is holding nothing back from the cameras while appearing on the “Hertz. Let’s Go Show,” which is hosted by actress…
May 22, 2023
Hertz and Mayor Dyer Launch “Hertz Electrifies Orlando”
Hertz and City of Orlando Launch Partnership to Expand Electric Vehicle Rentals, EV Charging Infrastructure and Education and Training Opportunities
ORLANDO, Fla., May 11, 2023 /PRNewswire/ — Hertz (NASDAQ: HTZ) chair and CEO Stephen Scherr and Orla…
May 11, 2023
HERTZ REPORTS FIRST QUARTER 2023 RESULTS: REVENUE OF $2.0 BILLION, NET INCOME OF $196 MILLION AND ADJUSTED CORPORATE EBITDA OF $237 MILLION
“Hertz posted strong results in the first quarter, reflecting continued growth in demand across all customer segments and sustained pricing both in the U.S. and abroad,” said Stephen Scherr, Hertz chair and chief executive officer. “Our continued inv…
April 27, 2023
Hertz and Mayor Dickens Launch “Hertz Electrifies Atlanta”
Hertz and City of Atlanta Launch Partnership to Expand Electric Vehicle Rentals, EV Charging Infrastructure and Education and Training Opportunities
ATLANTA, April 19, 2023 /PRNewswire/ — Hertz (NASDAQ: HTZ) chair and CEO Stephen Scherr and Mayor of…
April 19, 2023
Hertz Global Holdings, Inc. to Announce First Quarter 2023 Financial Results on April 27th
ESTERO, Fla., April 3, 2023 /PRNewswire/ — Hertz Global Holdings, Inc. (NASDAQ: HTZ) (the “Company”) announced today that it plans to report its first quarter 2023 financial results at approximately 7:30 a.m. ET on Thursday, April 27, 2023 followed …
April 3, 2023
Hertz Announces Departure of Chief Financial Officer
ESTERO, Fla., March 27, 2023 /PRNewswire/ — Hertz Global Holdings, Inc. (Nasdaq: HTZ) today announced that it has appointed Alexandra Brooks, its Chief Accounting Officer, as interim Chief Financial Officer effective April 1, 2023. Ms. Brooks will r…
March 27, 2023
Hertz, Mayor Turner and Evolve Houston Launch “Hertz Electrifies Houston”
The Hertz Corporation. (PRNewsfoto/Hertz)
bp logo
Hertz aims to add EVs to Houston fleet and support bp’s installation of a publicly accessible EV fast-charging hub at the Hertz location at Houston Hobby Airport
HOUSTON, March 7, 2023 /PRNewswire/ -…
March 7, 2023
Hertz Launches “Hertz Electrifies” in Denver
Partnership with Montbello Career and Technical High School
Jumpstarts Training for Jobs of the Future
DENVER, March 3, 2023 /PRNewswire/ — Hertz (NASDAQ: HTZ) Chair and CEO Stephen Scherr and Denver Mayor Michael Hancock launched Hertz Electrifies …
March 3, 2023
HERTZ REPORTS STRONG FOURTH QUARTER AND RECORD FULL YEAR 2022 NET INCOME AND ADJUSTED CORPORATE EBITDA
“Our strong results in the fourth quarter and record performance last year reflect a commitment to customers – from leisure and corporate travelers to ride share drivers. With a focus on asset return and risk management, we showed better operating pe…
February 7, 2023
Hertz and AAA Ready to Ignite the Next Chapter of Longstanding Partnership
The two marquee brands celebrate 45 years of partnership and look toward the future with new five-year agreement
ESTERO, Fla. and ORLANDO, Fla., Jan. 25, 2023 /PRNewswire/ — Hertz, one of the most recognized vehicle rental companies around the globe…
January 25, 2023
HERTZ ANNOUNCES CHANGES TO ITS BOARD OF DIRECTORS
Michael Gregory (Greg) O’Hara to Step Down; CEO Stephen Scherr Appointed Board Chair;
Fran Bermanzohn and Jeff Nedelman Join
ESTERO, Fla., Jan. 18, 2023 /PRNewswire/ — Hertz Global Holdings, Inc. (NASDAQ: HTZ) announced today certain changes to the …
January 18, 2023
Hertz Global Holdings, Inc. to Announce Fourth Quarter 2022 Financial Results on February 7
ESTERO, Fla., Jan. 5, 2023 /PRNewswire/ — Hertz Global Holdings, Inc. (NASDAQ: HTZ) (the “Company”) announced today that it plans to report its fourth quarter 2022 financial results at approximately 7:30 a.m. ET on Tuesday, February 7, 2023 followed…
January 5, 2023
HERTZ NAMES WAYNE DAVIS AS CHIEF MARKETING OFFICER
ESTERO, Fla., Dec. 8, 2022 /PRNewswire/ — Hertz Global Holdings Inc. (NASDAQ: HTZ) announced today that veteran marketing and sales executive Wayne Davis will join the company as Executive Vice President, Chief Marketing Officer (CMO), effective Jan…
December 8, 2022
Hertz Announces Settlement Agreements Related to Past Legal Claims
ESTERO, Fla., Dec. 5, 2022 /PRNewswire/ — Hertz Global Holdings, Inc. (NASDAQ: HTZ) today announced the settlement of 364 pending claims relating to vehicle theft reporting, bringing resolution to more than 95% of its pending theft reporting claims….
December 5, 2022
HERTZ REPORTS THIRD QUARTER 2022 RESULTS: REVENUE OF $2.5 BILLION, NET INCOME OF $577 MILLION, ADJUSTED CORPORATE EBITDA OF $618 MILLION, OPERATING CASH FLOW OF $932 MILLION AND ADJUSTED FREE CASH FLOW OF $505 MILLION
“Hertz posted another quarter of solid performance, reflecting overall strength in our business and continued demand for our services across all customer segments,” said Stephen Scherr, Hertz chief executive officer. “I am enormously proud of the per…
October 27, 2022
Hertz Partners with Palantir to Drive Operational Excellence and Enhance Customer Experience
The Hertz Corporation. (PRNewsfoto/Hertz)
Palantir logo
ESTERO, Fla. and DENVER, Oct. 19, 2022 /PRNewswire/ — Hertz (NASDAQ: HTZ) and Palantir Technologies Inc. (NYSE: PLTR, “Palantir”), a leading builder of operating systems for the modern enterpr…
October 19, 2022
Hertz Provides $1 Million to Support Hurricane Ian Relief and Recovery Efforts in its Home State of Florida
ESTERO, Fla., Oct. 6, 2022 /PRNewswire/ — Hertz (NASDAQ: HTZ) today announced $1 million in contributions to support relief and recovery efforts across Southwest Florida and to further assist Hertz employees who live in areas impacted by Hurricane I…
October 6, 2022
Hertz Global Holdings, Inc. to Announce Third Quarter 2022 Financial Results on October 27
ESTERO, Fla., Oct. 6, 2022 /PRNewswire/ — Hertz Global Holdings, Inc. (NASDAQ: HTZ) (the “Company”) announced today that it plans to report its third quarter 2022 financial results at approximately 7:30 a.m. ET on Thursday, October 27, 2022 followed…
October 6, 2022
Hertz, bp collaborate to accelerate EV charging in North America
The Hertz Corporation. (PRNewsfoto/Hertz)
bp logo
Hertz, bp collaborate to accelerate EV charging in North America
Hertz and bp pulse plan to install a national network of EV charging solutions for Hertz and its customers, powered by bp pulse
Compa…
September 27, 2022
HERTZ REPORTS SECOND QUARTER RESULTS: REVENUE OF $2.3 BILLION, NET INCOME OF $940 MILLION, ADJUSTED CORPORATE EBITDA OF $764 MILLION, OPERATING CASH FLOW OF $708 MILLION AND ADJUSTED FREE CASH FLOW OF $484 MILLION
“Our second quarter results were impressive and position us well for the peak summer season,” said Stephen Scherr, Hertz chief executive officer. “We produced record Adjusted Corporate EBITDA and adjusted free cash flow, taking advantage of positive …
July 28, 2022
Hertz Global Holdings, Inc. to Announce Second Quarter 2022 Financial Results on July 28
ESTERO, Fla., July 5, 2022 /PRNewswire/ — Hertz Global Holdings, Inc. (NASDAQ: HTZ) (the “Company”) announced today that it plans to report its second quarter 2022 financial results at approximately 7:30 a.m. ET on Thursday, July 28, 2022 followed b…