Hertz extends its partnership with the seven-time Super Bowl champion through 2024
ESTERO, Fla., May 22, 2023 /PRNewswire/ — Tom Brady is holding nothing back from the cameras while appearing on the "Hertz. Let’s Go Show," which is hosted by actress and comedian Yvonne Orji and is the fictional daytime talk show premise for the latest series of new digital ads debuting today as part of the Hertz. Let’s Go! campaign. During an "exclusive" interview with Orji, Brady hilariously reveals his deep affinity for Hertz.
Tom Brady Reveals All in “Electrifying” New Hertz Ads Featuring Yvonne Orji.
In the campaign’s hero spot, the five-time Super Bowl MVP finds himself baring his soul to Orji on the show, ultimately winning a ‘Let’s Go moment’ in a Hertz electric vehicle (EV) rental. Brady and Orji recreate multiple iconic daytime talk show moments in the new series while highlighting Hertz’s diverse vehicle options – including its growing EV fleet – Hertz Gold Plus Rewards loyalty program, partnerships, global footprint and more.
"The Hertz. Let’s Go! campaign has effectively shined a spotlight on our fast and seamless service, and innovative vehicle offerings, including our EV rentals," said Wayne Davis, Hertz’s chief marketing officer. "Tom Brady has been such an authentic and enthusiastic partner for Hertz and this campaign, that we mutually decided to extend our partnership through 2024. We can’t wait for people to engage with the next phase of the campaign as Tom and Yvonne bring their talent and humor to showcase the many elements that make renting from Hertz a great way to travel and create memories."
Brady and Hertz first teamed up in October 2021 as the company announced its industry-leading investment in EVs, and have released several ads over the past three years using topical humor to highlight Hertz’s diverse and unique vehicle offerings and customer service. Brady is once again along for the ride with Hertz as it expands its electric vehicle offerings through large-scale purchases with Tesla, Polestar and General Motors that enable the brand to offer a variety of EVs at a range of price points.
"I appreciate my close collaboration with Hertz because it truly is so natural and authentic to me," said Brady. "There is such a true connection to ‘Let’s Go’ as it relates to travel and the desire to have a seamless experience which Hertz always provides. Being an EV driver, I also love that more people across the country will have the opportunity to experience Hertz’s EV rental fleet. I’ve been driving one for a long time and seeing Hertz continue to invest in them is amazing."
According to Orji, joining the campaign was a no-brainer as she’s a longtime Hertz customer and true believer in the ‘Let’s Go’ mantra as well.
"I love a good ‘Let’s Go moment’ because I never like to feel restricted or live with the restraints of when and how you can take a break," said Orji. "I let my body decide when it’s time to tap out and then I hit the open road."
The ads will be featured on premium streaming networks – Hulu, Disney, HBO Max, Peacock, Warner Bros. and Discovery – YouTube and across Facebook, Instagram, and TikTok with accompanying audio ads on Pandora. The hero spot can be viewed here on YouTube.
ABOUT HERTZ
Hertz, one of the most recognized brands in the world, has a long-standing legacy of providing a fast and easy experience designed to make every journey special. It starts with top-rated vehicles to fit every traveler’s needs, delivered with a caring touch and personalized services including its award-winning Hertz Gold Plus Rewards loyalty program, Ultimate Choice, Hertz app, and more. To learn more or to reserve a vehicle at an airport or a convenient neighborhood Hertz location, visit Hertz.com.
Hertz pioneered the car rental industry more than 100 years ago and today is owned by Hertz Global Holdings, Inc. which includes Dollar and Thrifty vehicle rental brands.
Hertz and City of Orlando Launch Partnership to Expand Electric Vehicle Rentals, EV Charging Infrastructure and Education and Training Opportunities
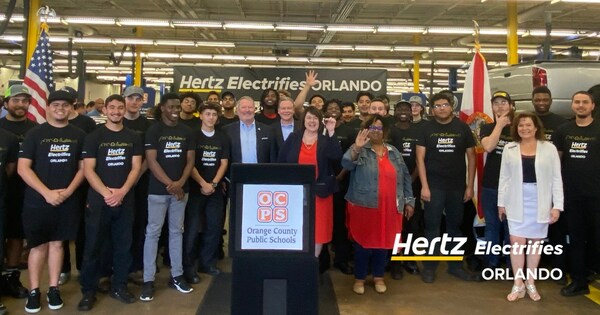
ORLANDO, Fla., May 11, 2023 /PRNewswire/ — Hertz (NASDAQ: HTZ) chair and CEO Stephen Scherr and Orlando Mayor Buddy Dyer launched Hertz Electrifies Orlando, a public private partnership aimed at accelerating the adoption of electric vehicles (EVs) and expanding the environmental and economic benefits of electrification across Orlando.
Hertz CEO and Chair Stephen Scherr joins City of Orlando Mayor Buddy Dyer, Orange County Public School Leaders, and students from Orange Technical College to celebrate the launch of Hertz Electrifies Orlando.
As part of the partnership, Hertz aims to add up to 6,000 rental EVs to its existing fleet in Orlando, for availability to leisure and business customers as well as rideshare drivers. To help expand charging, Hertz will support the installation of up to 50 public fast chargers across the Greater Orlando area, in partnership with bp. In addition, Hertz is working with Orange Technical College (OTC) to help bring EV tools and training to its auto servicing students. Hertz is also making summer jobs available through the city’s Summer Youth Employment Program.
"We are thrilled to partner with Mayor Dyer to launch Hertz Electrifies in Orlando, the largest rental car market in the world," said Stephen Scherr, Hertz chair and CEO. "It seems fitting that we are launching this public private partnership during National Travel & Tourism Week, given the city’s enormous importance as a destination for travelers around the globe. Hertz is excited to expand our EV offerings to our diverse customer set in Orlando, and to partner with Orlando Technical College to help bring EV education and training opportunities to students."
Hertz Electrifies Orlando aligns with Mayor Dyer’s 2030 Electric Mobility Roadmap goals to accelerate EV adoption in multiple transportation sectors and develop a robust charging ecosystem to reduce emissions that harm public health, bolster climate change resilience, and increase access and affordability for all communities.
"We have the opportunity to transform our transportation landscape as we work to be the most sustainable city in the southeast," said Orlando Mayor Buddy Dyer. "Our partnership with Hertz Electrifies will help us meet our goal of accelerating electric vehicles and expanding charging infrastructure. We are making Orlando ready for the future and working to ensure that everyone experiences the benefits that electric mobility options can bring, including our future workforce."
To help support the next generation of EV technicians, Hertz is donating an electric vehicle to Orange Technical College and providing EV education and training materials that will enable the school to incorporate EV technology into its auto servicing programs.
"Having access to electric vehicles provides critical hands-on experience with new technology for students in Orange County," said Dr. Maria Vazquez, Superintendent of Orange County Public Schools. "We are truly grateful for Hertz for donating this vehicle and we look forward to a future partnership to increase education and training opportunities."
Orlando is the fourth City to partner with Hertz through Hertz Electrifies, as part of a multi-city rollout of this national public-private initiative.
About Hertz Electrifies Hertz Electrifies is a new public-private partnership aimed at furthering the mainstream adoption of electric vehicles and extending the benefits of electrification to communities throughout the United States. The initiative works to: (1) expand electric vehicle fleets (2) accelerate EV charging infrastructure; (3) build education and training opportunities for jobs of the future; and (4) help broaden economic opportunity through electrification. For more information visit www.hertz.com/electrifies.
About Hertz The Hertz Corporation, a subsidiary of Hertz Global Holdings, Inc., operates the Hertz, Dollar and Thrifty vehicle rental brands throughout North America, Europe, the Caribbean, Latin America, Africa, the Middle East, Asia, Australia and New Zealand. The Hertz Corporation is one of the largest worldwide vehicle rental companies, and the Hertz brand is one of the most recognized globally. Additionally, The Hertz Corporation operates the Firefly vehicle rental brand and Hertz 24/7 car sharing business in international markets and sells vehicles through Hertz Car Sales. For more information about The Hertz Corporation, visit www.hertz.com. Hertz has tens of thousands of EVs available at more than 500 Hertz locations across 38 states.
About The City of Orlando Orlando, a city with more than 300,000 residents located in the heart of Central Florida, has gained international notoriety from its theme parks and attractions that annually draw more than 70 million people from around the globe. With a goal of being the most sustainable city in the southeast, the City of Orlando is actively moving towards its goal to convert 100% of its municipal fleet to electric or alternative fuel vehicles by 2030. As part of this effort, the city is expanding charging infrastructure across the entire community to be one of the most equitable and future-ready cities in the nation.
About Orange Technical College Orange Technical College, a part of Orange County Public Schools, focuses on improving students’ lives and positively impacting workforce needs throughout Central Florida. Throughout five technical college campuses, students learn the industry skills needed to start an in-demand CAREER, attain their high school diploma, become an apprentice, learn English, and expand their current skills to make them more marketable to employers.
About Orange County Public Schools Orange County Public Schools is the eighth-largest school district in the United States and the fourth largest in Florida. The district serves about 209,000 students at 210 schools and is one of the largest employers in Central Florida with roughly 25,000 team members.
Cautionary Note Concerning Forward-Looking Statements This press release contains "forward-looking statements" within the meaning of the federal securities laws. Words such as "aim," "create," "accelerate," "transition," "will," "build," "future," "transform," "invest," "shift," "launch," "increase," "initiative," "expand," add," and "develop," and similar expressions identify forward-looking statements, which include but are not limited to statements related to the expansion of Hertz’s EV fleet and its partnership with Uber, installation of charging infrastructure including in partnership with bp, and any other statements regarding future expectations, beliefs, plans, objectives, future events or performance. We caution you that these statements are not guarantees of future performance and are subject to numerous evolving risks and uncertainties that we may not be able to accurately predict or assess, including Hertz’s ability to expand its EV fleet, develop and install sufficient EV charging infrastructure, and otherwise execute on its strategic plans, as well as other factors identified in the risk factors of Hertz’s Annual Report on Form 10-K for the year ended December 31, 2021, as filed with the Securities and Exchange Commission (the "SEC") on February 23, 2022 and any updates thereto in subsequent filings with the SEC including in Hertz’s Quarterly Reports on Form 10-Q. We caution you not to place undue reliance on our forward-looking statements, which speak only as of their date, and Hertz undertakes no obligation to update this information.
"Hertz posted strong results in the first quarter, reflecting continued growth in demand across all customer segments and sustained pricing both in the U.S. and abroad," said Stephen Scherr, Hertz chair and chief executive officer. "Our continued investments in the business, particularly in the areas of technology and electrification, are improving our operational cadence, extending our reach in rideshare, and enabling the revitalization of our value brands, all with a view toward delivering sustainable returns for our shareholders. We look forward to serving our customers with excellence during the upcoming summer season."
ESTERO, Fla., April 27, 2023 /PRNewswire/ — Hertz Global Holdings, Inc. (NASDAQ: HTZ) ("Hertz", "Hertz Global" or the "Company") today reported results for its first quarter 2023.
HIGHLIGHTS
Total revenues of $2.0 billion
GAAP net income of $196 million, or $0.61 per diluted share
Adjusted Net Income of $126 million, or $0.39 per adjusted diluted share
Adjusted Corporate EBITDA of $237 million, a 12% margin
Operating cash flow of $562 million, adjusted operating cash flow of $104 million
Adjusted free cash outflow of $83 million
Corporate liquidity of $2.2 billion at March 31, including $728 million in unrestricted cash
Company utilized $100 million to repurchase 5.7 million common shares during the quarter
FIRST QUARTER RESULTS
First quarter revenue was $2.0 billion, up 13% year over year, characterized by continued strength in leisure and corporate demand. Transaction days increased 10% year over year while average fleet was up 5%. Monthly revenue per unit in the quarter of $1,409, was up 7% year over year and benefited from a 280-basis point improvement in utilization and pricing strength.
Adjusted Corporate EBITDA was $237 million in the quarter. Fleet depreciation was $381 million, or $252 per unit per month. Fleet depreciation in the first quarter of 2022 reflected outsized gains on sale of vehicles. Adjusted Corporate EBITDA in the quarter included $88 million of gains from the monetization of interest rate caps associated with the Company’s HVFIII U.S. ABS facility.
Adjusted free cash outflow of $83 million in the quarter reflected an investment to grow the fleet to meet spring and summer demand.
During the first quarter of 2023, the Company repurchased 5.7 million shares of its common stock for $100 million. As of April 20, 2023, the Company had approximately $1.0 billion remaining under its share repurchase authorization.
The Company’s liquidity position was $2.2 billion at March 31, 2023, of which $728 million was unrestricted cash.
SUMMARY RESULTS
Three Months Ended
March 31,
Percent Inc/ (Dec)
2023 vs 2022
($ in millions, except earnings per share or where noted)
2023
2022
Hertz Global – Consolidated
Total revenues
$ 2,047
$ 1,810
13 %
Adjusted net income (loss)(a)
$ 126
$ 403
(69) %
Adjusted diluted earnings (loss) per share(a)
$ 0.39
$ 0.87
(55) %
Adjusted Corporate EBITDA(a)
$ 237
$ 614
(61) %
Adjusted Corporate EBITDA Margin(a)
12 %
34 %
Average Vehicles (in whole units)
504,528
481,211
5 %
Average Rentable Vehicles (in whole units)
483,288
455,517
6 %
Vehicle Utilization
77 %
75 %
Transaction Days (in thousands)
33,787
30,621
10 %
Total RPD (in dollars)(b)
$ 60.48
$ 58.54
3 %
Total RPU Per Month (in whole dollars)(b)
$ 1,409
$ 1,312
7 %
Depreciation Per Unit Per Month (in whole dollars)(b)
$ 252
$ (42)
NM
Americas RAC Segment
Total revenues
$ 1,730
$ 1,558
11 %
Adjusted EBITDA
$ 261
$ 641
(59) %
Adjusted EBITDA Margin
15 %
41 %
Average Vehicles (in whole units)
412,983
397,620
4 %
Average Rentable Vehicles (in whole units)
393,512
373,153
5 %
Vehicle Utilization
79 %
76 %
Transaction Days (in thousands)
27,879
25,579
9 %
Total RPD (in dollars)(b)
$ 62.03
$ 60.81
2 %
Total RPU Per Month (in whole dollars)(b)
$ 1,465
$ 1,390
5 %
Depreciation Per Unit Per Month (in whole dollars)(b)
$ 282
$ (78)
NM
International RAC Segment
Total revenues
$ 317
$ 252
25 %
Adjusted EBITDA
$ 53
$ 27
97 %
Adjusted EBITDA Margin
17 %
11 %
Average Vehicles (in whole units)
91,545
83,591
10 %
Average Rentable Vehicles (in whole units)
89,776
82,364
9 %
Vehicle Utilization
72 %
68 %
Transaction Days (in thousands)
5,908
5,042
17 %
Total RPD (in dollars)(b)
$ 53.18
$ 47.00
13 %
Total RPU Per Month (in whole dollars)(b)
$ 1,167
$ 959
22 %
Depreciation Per Unit Per Month (in whole dollars)(b)
$ 115
$ 129
(11) %
NM – Not meaningful
(a) Represents a non-GAAP measure. See the accompanying reconciliations included in Supplemental Schedule II.
(b) Based on December 31, 2022 foreign exchange rates.
EARNINGS WEBCAST INFORMATION
Hertz Global’s live webcast and conference call to discuss its first quarter 2023 results will be held on April 27, 2023, at 8:30 a.m. Eastern Time. The conference call will be broadcast live in listen-only mode on the Company’s investor relations website at IR.Hertz.com. If you would like to access the call by phone and ask a question, please go to https://register.vevent.com/register/BI62d702e50f4c42c0b23858ca0440e2e4, and you will be provided with dial in details. Investors are encouraged to dial-in approximately 15 minutes prior to the call. A web replay will remain available on the website for approximately one year. The earnings release and related supplemental schedules containing the reconciliations of non-GAAP measures will be available on the Hertz website, IR.Hertz.com.
UNAUDITED FINANCIAL DATA, SUPPLEMENTAL SCHEDULES, NON-GAAP MEASURES AND DEFINITIONS
Following is selected financial data of Hertz Global. Also included are Supplemental Schedules, which are provided to present segment results, and reconciliations of non-GAAP measures to their most comparable GAAP measure. Following the Supplemental Schedules, the Company provides definitions for terminology used throughout the earnings release and its view of the usefulness of non-GAAP measures to investors and management.
ABOUT HERTZ
The Hertz Corporation, a subsidiary of Hertz Global Holdings, Inc., operates the Hertz, Dollar and Thrifty vehicle rental brands throughout North America, Europe, the Caribbean, Latin America, Africa, the Middle East, Asia, Australia and New Zealand. The Hertz Corporation is one of the largest worldwide vehicle rental companies, and the Hertz brand is one of the most recognized globally. Additionally, The Hertz Corporation owns and operates the Firefly vehicle rental brand and Hertz 24/7 car sharing business in international markets and sells vehicles through Hertz Car Sales. For more information about The Hertz Corporation, visit www.hertz.com.
Certain statements contained or incorporated by reference in this release, and in related comments by the Company’s management, include "forward-looking statements." Forward-looking statements include information concerning the Company’s liquidity and its possible or assumed future results of operations, including descriptions of its business strategies. These statements often include words such as "believe," "expect," "project," "potential," "anticipate," "intend," "plan," "estimate," "seek," "will," "may," "would," "should," "could," "forecasts," "guidance" or similar expressions. These statements are based on certain assumptions that the Company has made in light of its experience in the industry as well as its perceptions of historical trends, current conditions, expected future developments and other factors it believes are appropriate in these circumstances. The Company believes these judgments are reasonable, but you should understand that these statements are not guarantees of performance or results, and that the Company’s actual results could differ materially from those expressed in the forward-looking statements due to a variety of important factors, both positive and negative, that may be revised or supplemented in subsequent reports on Form 10-K, 10-Q and 8-K filed or furnished to the SEC.
Important factors that could affect the Company’s actual results and cause them to differ materially from those expressed in forward-looking statements include, among other things:
the Company’s ability to purchase adequate supplies of competitively priced vehicles at a reasonable cost in order to efficiently service rental demand, including as a result of disruptions in the global supply chain;
the Company’s ability to attract and retain effective frontline employees and senior management and other key employees;
levels of travel demand, particularly business and leisure travel in the U.S. and in global markets;
significant changes in the competitive environment and the effect of competition in the Company’s markets on rental volume and pricing;
occurrences that disrupt rental activity during the Company’s peak periods particularly in critical geographies;
the Company’s ability to accurately estimate future levels of rental activity and adjust the number and mix of vehicles used in its rental operations accordingly;
the Company’s ability to implement its business strategy or strategic transactions, including its ability to implement plans to support a large-scale electric vehicle fleet, execute its rideshare strategy and to play a central role in the modern mobility ecosystem;
the Company’s ability to adequately respond to changes in technology impacting the mobility industry;
the mix of vehicles in the Company’s fleet, including but not limited to program and non-program vehicles, which can lead to increased exposure to residual risk upon disposition;
increases in vehicle holding periods, which may result in additional maintenance costs and lower customer satisfaction;
financial instability of the manufacturers of the Company’s vehicles, which could impact their ability to fulfill obligations under repurchase or guaranteed depreciation programs;
increases in the level of recall activity by the manufacturers of the Company’s vehicles, which may increase the Company’s costs and can disrupt its rental activity due to safety recalls by the manufacturers of its vehicles;
the Company’s access to third-party distribution channels and related prices, commission structures and transaction volumes associated with those channels;
the Company’s ability to offer an excellent customer experience, retain and increase customer loyalty and increase market share;
the Company’s ability to maintain its network of leases and vehicle rental concessions at airports and other key locations in the U.S. and internationally;
the Company’s ability to maintain favorable brand recognition and a coordinated branding and portfolio strategy;
the Company’s ability to effectively manage its union relations and labor agreement negotiations;
the Company’s ability, and that of its key third-party partners, to prevent the misuse or theft of information the Company possesses, including as a result of cyber security breaches and other security threats, as well as to comply with privacy regulations across the globe;
a major disruption in the Company’s communication or centralized information networks or a failure to maintain, upgrade and consolidate its information technology systems;
risks associated with operating in many different countries, including the risk of a violation or alleged violation of applicable anti-corruption or anti-bribery laws and the Company’s ability to repatriate cash from non-U.S. affiliates without adverse tax consequences;
risks relating to tax laws, including those that affect the Company’s ability to offset future tax on fleet dispositions, as well as any adverse determinations or rulings by tax authorities;
the Company’s ability to utilize its net operating loss carryforwards;
the Company’s exposure to uninsured liabilities relating to personal injury, death and property damage, or otherwise;
changes in laws, regulations, policies or other activities of governments, agencies and similar organizations, including those related to accounting principles, that affect the Company’s operations, its costs or applicable tax rates;
the recoverability of the Company’s goodwill and indefinite-lived intangible assets when performing impairment analysis;
costs and risks associated with potential litigation and investigations, compliance with and changes in laws and regulations and potential exposures under environmental laws and regulations;
the Company’s ability to comply with ESG regulations, meet increasing ESG expectations of stakeholders, and otherwise achieve ESG goals;
the availability of additional or continued sources of financing at acceptable rates for the Company’s revenue earning vehicles and to refinance its existing indebtedness;
volatility in the Company’s stock price and certain provisions of its charter documents which could negatively affect the market price of the Company’s common stock;
the Company’s ability to effectively maintain effective internal controls over financial reporting; and
the Company’s ability to implement an effective business continuity plan to protect the business in exigent circumstances.
Additional information concerning these and other factors can be found in the Company’s filings with the SEC, including its Annual Reports on Form 10-K, Quarterly Reports on Form 10-Q and Current Reports on Form 8-K.
You should not place undue reliance on forward-looking statements. All forward-looking statements attributable to the Company or persons acting on its behalf are expressly qualified in their entirety by the foregoing cautionary statements. All such statements speak only as of the date of this release, and, except as required by law, the Company undertakes no obligation to update or revise publicly any forward-looking statements, whether as a result of new information, future events or otherwise.
UNAUDITED FINANCIAL INFORMATION
UNAUDITED CONSOLIDATED STATEMENTS OF OPERATIONS
Three Months Ended
March 31,
(In millions, except per share data)
2023
2022
Revenues
$ 2,047
$ 1,810
Expenses:
Direct vehicle and operating
1,221
1,053
Depreciation of revenue earning vehicles and lease charges, net
381
(59)
Depreciation and amortization of non-vehicle assets
35
33
Selling, general and administrative
221
235
Interest expense, net:
Vehicle
111
5
Non-vehicle
51
39
Total interest expense, net
162
44
Other (income) expense, net
9
(2)
(Gain) on sale of non-vehicle capital assets
(162)
—
Change in fair value of Public Warrants
118
(50)
Total expenses
1,985
1,254
Income (loss) before income taxes
62
556
Income tax (provision) benefit
134
(130)
Net income (loss)
$ 196
$ 426
Weighted average number of shares outstanding:
Basic
321
432
Diluted
323
461
Earnings (loss) per share:
Basic
$ 0.61
$ 0.99
Diluted
$ 0.61
$ 0.82
UNAUDITED CONSOLIDATED BALANCE SHEETS
(In millions, except par value and share data)
March 31, 2023
December 31, 2022
ASSETS
Cash and cash equivalents
$ 728
$ 943
Restricted cash and cash equivalents:
Vehicle
216
180
Non-vehicle
298
295
Total restricted cash and cash equivalents
514
475
Total cash and cash equivalents and restricted cash and cash equivalents
1,242
1,418
Receivables:
Vehicle
136
111
Non-vehicle, net of allowance of $42 and $45, respectively
898
863
Total receivables, net
1,034
974
Prepaid expenses and other assets
980
1,155
Revenue earning vehicles:
Vehicles
15,746
14,281
Less: accumulated depreciation
(1,888)
(1,786)
Total revenue earning vehicles, net
13,858
12,495
Property and equipment, net
642
637
Operating lease right-of-use assets
2,067
1,887
Intangible assets, net
2,882
2,887
Goodwill
1,044
1,044
Total assets
$ 23,749
$ 22,497
LIABILITIES AND STOCKHOLDERS’ EQUITY
Accounts payable:
Vehicle
$ 167
$ 79
Non-vehicle
553
578
Total accounts payable
720
657
Accrued liabilities
926
911
Accrued taxes, net
173
170
Debt:
Vehicle
11,789
10,886
Non-vehicle
2,975
2,977
Total debt
14,764
13,863
Public Warrants
735
617
Operating lease liabilities
1,977
1,802
Self-insured liabilities
457
472
Deferred income taxes, net
1,223
1,360
Total liabilities
20,975
19,852
Commitments and contingencies
Stockholders’ equity:
Preferred stock, $0.01 par value, no shares issued and outstanding
—
—
Common stock, $0.01 par value, 479,114,852 and 478,914,062 shares issued, respectively, and 317,948,320 and 323,483,178 shares outstanding, respectively
5
5
Treasury stock, at cost, 161,166,532 and 155,430,884 common shares, respectively
(3,237)
(3,136)
Additional paid-in capital
6,346
6,326
Retained earnings (Accumulated deficit)
(60)
(256)
Accumulated other comprehensive income (loss)
(280)
(294)
Total stockholders’ equity
2,774
2,645
Total liabilities and stockholders’ equity
$ 23,749
$ 22,497
UNAUDITED CONSOLIDATED STATEMENTS OF CASH FLOWS
Three Months Ended
March 31,
(In millions)
2023
2022
Cash flows from operating activities:
Net income (loss)
$ 196
$ 426
Adjustments to reconcile net income (loss) to net cash provided by (used in) operating activities:
Depreciation and reserves for revenue earning vehicles
466
(20)
Depreciation and amortization, non-vehicle
35
33
Amortization of deferred financing costs and debt discount (premium)
14
11
Stock-based compensation charges
21
28
Provision for receivables allowance
20
13
Deferred income taxes, net
(135)
103
(Gain) loss on sale of non-vehicle capital assets
(162)
(2)
Change in fair value of Public Warrants
118
(50)
Changes in financial instruments
108
(44)
Other
—
1
Changes in assets and liabilities:
Non-vehicle receivables
(50)
(43)
Prepaid expenses and other assets
(48)
(40)
Operating lease right-of-use assets
78
72
Non-vehicle accounts payable
(27)
51
Accrued liabilities
29
124
Accrued taxes, net
1
30
Operating lease liabilities
(84)
(80)
Self-insured liabilities
(18)
8
Net cash provided by (used in) operating activities
562
621
Cash flows from investing activities:
Revenue earning vehicles expenditures
(2,824)
(2,985)
Proceeds from disposal of revenue earning vehicles
1,206
1,471
Non-vehicle capital asset expenditures
(45)
(30)
Proceeds from non-vehicle capital assets disposed of or to be disposed of
175
1
Collateral returned in exchange for letters of credit
—
17
Return of (investment in) equity investments
—
(15)
Net cash provided by (used in) investing activities
(1,488)
(1,541)
Cash flows from financing activities:
Proceeds from issuance of vehicle debt
2,061
4,680
Repayments of vehicle debt
(1,190)
(3,492)
Proceeds from issuance of non-vehicle debt
425
—
Repayments of non-vehicle debt
(430)
(5)
Payment of financing costs
(8)
(24)
Proceeds from exercises of Public Warrants
—
3
Share repurchases
(118)
(766)
Other
(1)
(4)
Net cash provided by (used in) financing activities
739
392
Effect of foreign currency exchange rate changes on cash and cash equivalents and restricted cash and cash equivalents
11
(1)
Net increase (decrease) in cash and cash equivalents and restricted cash and cash equivalents during the period
(176)
(529)
Cash and cash equivalents and restricted cash and cash equivalents at beginning of period
1,418
2,651
Cash and cash equivalents and restricted cash and cash equivalents at end of period
$ 1,242
$ 2,122
Supplemental Schedule I
HERTZ GLOBAL HOLDINGS, INC.
CONDENSED STATEMENT OF OPERATIONS BY SEGMENT
Unaudited
Three Months Ended March 31, 2023
Three Months Ended March 31, 2022
(In millions)
Americas RAC
International RAC
Corporate
Hertz Global
Americas RAC
International RAC
Corporate
Hertz Global
Revenues
$ 1,730
$ 317
$ —
$ 2,047
$ 1,558
$ 252
$ —
$ 1,810
Expenses:
Direct vehicle and operating
1,039
182
—
1,221
903
151
(1)
1,053
Depreciation of revenue earning vehicles and lease charges, net
349
32
—
381
(93)
34
—
(59)
Depreciation and amortization of non-vehicle assets
28
2
5
35
26
3
4
33
Selling, general and administrative
105
37
79
221
86
42
107
235
Interest expense, net:
Vehicle
93
18
—
111
2
3
—
5
Non-vehicle
(18)
(2)
71
51
(8)
—
47
39
Total interest expense, net
75
16
71
162
(6)
3
47
44
Other (income) expense, net
(1)
6
4
9
(1)
(3)
2
(2)
(Gain) on sale of non-vehicle capital assets
(162)
—
—
(162)
—
—
—
—
Change in fair value of Public Warrants
—
—
118
118
—
—
(50)
(50)
Total expenses
1,433
275
277
1,985
915
230
109
1,254
Income (loss) before income taxes
$ 297
$ 42
$ (277)
62
$ 643
$ 22
$ (109)
556
Income tax (provision) benefit
134
(130)
Net income (loss)
$ 196
$ 426
Supplemental Schedule II
HERTZ GLOBAL HOLDINGS, INC. RECONCILIATION OF GAAP TO NON-GAAP MEASURE – ADJUSTED NET INCOME (LOSS), ADJUSTED DILUTED EARNINGS (LOSS) PER SHARE AND ADJUSTED CORPORATE EBITDA Unaudited
Three Months Ended
March 31,
(In millions, except per share data)
2023
2022
Adjusted Net Income (Loss) and Adjusted Diluted Earnings (Loss) Per Share:
Net income (loss)
$ 196
$ 426
Adjustments:
Income tax provision (benefit)
(134)
130
Vehicle and non-vehicle debt-related charges(a)(k)
14
12
Restructuring and restructuring related charges(b)
3
6
Acquisition accounting-related depreciation and amortization(c)
—
1
Unrealized (gains) losses on financial instruments(d)
108
(44)
(Gain) on sale of non-vehicle capital assets(e)
(162)
—
Change in fair value of Public Warrants
118
(50)
Other items(f)(l)
14
56
Adjusted pre-tax income (loss)(g)
157
537
Income tax (provision) benefit on adjusted pre-tax income (loss)(h)
(31)
(134)
Adjusted Net Income (Loss)
$ 126
$ 403
Weighted-average number of diluted shares outstanding
323
461
Adjusted Diluted Earnings (Loss) Per Share(i)
$ 0.39
$ 0.87
Adjusted Corporate EBITDA:
Net income (loss)
$ 196
$ 426
Adjustments:
Income tax provision (benefit)
(134)
130
Non-vehicle depreciation and amortization(j)
35
33
Non-vehicle debt interest, net of interest income
51
39
Vehicle debt-related charges(a)(k)
10
7
Restructuring and restructuring related charges(b)
3
6
Unrealized (gains) losses on financial instruments(d)
108
(44)
(Gain) on sale of non-vehicle capital assets(e)
(162)
—
Change in fair value of Public Warrants
118
(50)
Other items(f)(m)
12
67
Adjusted Corporate EBITDA
$ 237
$ 614
Supplemental Schedule II (continued)
(a)
Represents debt-related charges relating to the amortization of deferred financing costs and debt discounts and premiums.
(b)
Represents charges incurred under restructuring actions as defined in U.S. GAAP, excluding impairments and asset write-downs. Also includes restructuring related charges such as incremental costs incurred directly supporting business transformation initiatives. For the three months ended March 31, 2023 and 2022, respectively, charges incurred related primarily to International RAC.
(c)
Represents incremental expense associated with the amortization of other intangible assets and depreciation of property and equipment relating to acquisition accounting.
(d)
Represents unrealized gains (losses) on derivative financial instruments, primarily associated with Americas RAC. In 2023, also includes the realization of $88 million of previously unrealized gains resulting from the unwind of certain interest rate caps in Americas RAC.
(e)
Represents gain on the sale of certain non-vehicle capital assets sold in March 2023 in Americas RAC.
(f)
Represents miscellaneous items. For 2023, primarily includes certain IT related charges primarily in Corporate. For 2022, primarily includes bankruptcy claims, certain professional fees and charges related to the settlement of bankruptcy claims.
(g)
Adjustments by caption on a pre-tax basis were as follows:
Increase (decrease) to expenses
Three Months Ended March 31,
(In millions)
2023
2022
Direct vehicle and operating
$ —
$ (2)
Depreciation of revenue earning vehicles and lease charges, net
2
—
Selling, general and administrative
(14)
(5)
Interest expense, net:
Vehicle
(119)
36
Non-vehicle
(8)
(5)
Total interest expense, net
(127)
31
Other income (expense), net
—
(55)
Gain on sale non-vehicle capital assets
162
—
Change in fair value of Public Warrants
(118)
50
Total adjustments
$ (95)
$ 19
(h)
Derived utilizing a combined statutory rate of 20% and 25% for the three months ended March 31, 2023 and 2022, respectively, applied to the respective Adjusted Pre-tax Income (Loss). The decrease in rate is primarily resulting from EV-related tax credits anticipated to be used to decrease the Company’s U.S. federal tax provision throughout 2023 based on the Company’s expected purchases of electric vehicles.
(i)
Adjustments used to reconcile diluted earnings (loss) per share on a GAAP basis to Adjusted Diluted Earnings (Loss) Per Share are comprised of the same adjustments, inclusive of the tax impact, used to reconcile net income (loss) to Adjusted Net Income (Loss) divided by the weighted-average diluted shares outstanding during the period.
(j)
Non-vehicle depreciation and amortization expense for Americas RAC, International RAC and Corporate for the three months ended March 31, 2023 was $28 million, $2 million and $5 million, respectively. For the three months ended March 31, 2022 was $26 million, $3 million, and $4 million for Americas RAC, International RAC and Corporate, respectively.
(k)
Vehicle debt-related charges for Americas RAC and International RAC for the three months ended March 31, 2023 were $8 million and $1 million, respectively, and were $6 million and $1 million, respectively, for the three months ended March 31, 2022.
(l)
Also includes letter of credit fees recorded primarily in Corporate.
(m)
In 2022, also includes an adjustment for certain non-cash stock-based compensation charges recorded in Corporate.
Supplemental Schedule III
HERTZ GLOBAL HOLDINGS, INC.
RECONCILIATION OF GAAP TO NON-GAAP MEASURE – ADJUSTED OPERATING CASH FLOW
AND ADJUSTED FREE CASH FLOW
Unaudited
Three Months Ended
March 31,
(In millions)
2023
2022
ADJUSTED OPERATING CASH FLOW AND ADJUSTED FREE CASH FLOW:
Net cash provided by (used in) operating activities
$ 562
$ 621
Depreciation and reserves for revenue earning vehicles
(466)
20
Bankruptcy related payments (post emergence) and other payments
8
36
Adjusted operating cash flow
104
677
Non-vehicle capital asset proceeds (expenditures), net
130
(29)
Adjusted operating cash flow before vehicle investment
234
648
Net fleet growth after financing
(317)
(569)
Adjusted free cash flow
$ (83)
$ 79
CALCULATION OF NET FLEET GROWTH AFTER FINANCING:
Revenue earning vehicles expenditures
$ (2,824)
$ (2,985)
Proceeds from disposal of revenue earning vehicles
1,206
1,471
Revenue earning vehicles capital expenditures, net
(1,618)
(1,514)
Depreciation and reserves for revenue earning vehicles
466
(20)
Financing activity related to vehicles:
Borrowings
2,061
$ 4,680
Payments
(1,190)
$ (3,492)
Restricted cash changes, vehicle
(36)
$ (223)
Net financing activity related to vehicles
835
965
Net fleet growth after financing
$ (317)
$ (569)
Supplemental Schedule IV
HERTZ GLOBAL HOLDINGS, INC.
NET DEBT CALCULATION
Unaudited
As of March 31, 2023
As of December 31, 2022
(In millions)
Vehicle
Non-Vehicle
Total
Vehicle
Non-Vehicle
Total
Term loans
$ —
$ 1,522
$ 1,522
$ —
$ 1,526
$ 1,526
Senior notes
—
1,500
1,500
—
1,500
1,500
U.S. vehicle financing (HVF III)
10,283
—
10,283
9,406
—
9,406
International vehicle financing (Various)
1,490
—
1,490
1,466
—
1,466
Other debt
78
8
86
76
9
85
Debt issue costs, discounts and premiums
(62)
(55)
(117)
(62)
(58)
(120)
Debt as reported in the balance sheet
11,789
2,975
14,764
10,886
2,977
13,863
Add:
Debt issue costs, discounts and premiums
62
55
117
62
58
120
Less:
Cash and cash equivalents
—
728
728
—
943
943
Restricted cash
216
—
216
180
—
180
Restricted cash and restricted cash equivalents associated with Term C Loan
—
245
245
—
245
245
Net Debt
$ 11,635
$ 2,057
$ 13,692
$ 10,768
$ 1,847
$ 12,615
Corporate leverage ratio(a)
1.1x
0.8x
(a) Corporate leverage ratio is calculated as non-vehicle net debt divided by LTM Adjusted Corporate EBITDA.
Supplemental Schedule V
HERTZ GLOBAL HOLDINGS, INC.
KEY METRICS CALCULATIONS
REVENUE, UTILIZATION AND DEPRECIATION
Unaudited
Global RAC
Three Months Ended
March 31,
Percent Inc/ (Dec)
($ in millions, except where noted)
2023
2022
Total RPD
Revenues
$ 2,047
$ 1,810
Foreign currency adjustment(a)
(3)
(18)
Total Revenues – adjusted for foreign currency
$ 2,044
$ 1,792
Transaction Days (in thousands)
33,787
30,621
Total RPD (in dollars)
$ 60.48
$ 58.54
3 %
Total Revenue Per Unit Per Month
Total Revenues – adjusted for foreign currency
$ 2,044
$ 1,792
Average Rentable Vehicles (in whole units)
483,288
455,517
Total revenue per unit (in whole dollars)
$ 4,228
$ 3,935
Number of months in period (in whole units)
3
3
Total RPU Per Month (in whole dollars)
$ 1,409
$ 1,312
7 %
Vehicle Utilization
Transaction Days (in thousands)
33,787
30,621
Average Rentable Vehicles (in whole units)
483,288
455,517
Number of days in period (in whole units)
90
90
Available Car Days (in thousands)
43,609
40,999
Vehicle Utilization(b)
77 %
75 %
Depreciation Per Unit Per Month
Depreciation of revenue earning vehicles and lease charges, net
$ 381
$ (59)
Foreign currency adjustment(a)
—
(2)
Adjusted depreciation of revenue earning vehicles and lease charges
$ 381
$ (61)
Average Vehicles (in whole units)
504,528
481,211
Adjusted depreciation of revenue earning vehicles and lease charges divided by Average Vehicles (in whole dollars)
$ 756
$ (127)
Number of months in period (in whole units)
3
3
Depreciation Per Unit Per Month (in whole dollars)
$ 252
$ (42)
NM
Note: Global RAC represents Americas RAC and International RAC segment information on a combined basis and excludes Corporate
NM – Not meaningful
(a) Based on December 31, 2022 foreign exchange rates.
(b) Calculated as Transaction Days divided by Available Car Days.
Supplemental Schedule V (continued)
HERTZ GLOBAL HOLDINGS, INC.
KEY METRICS CALCULATIONS
REVENUE, UTILIZATION AND DEPRECIATION
Unaudited
Americas RAC
Three Months Ended March 31,
Percent Inc/ (Dec)
($ in millions, except where noted)
2023
2022
Total RPD
Revenues
$ 1,730
$ 1,558
Foreign currency adjustment(a)
(1)
(2)
Total Revenues – adjusted for foreign currency
$ 1,729
$ 1,556
Transaction Days (in thousands)
27,879
25,579
Total RPD (in dollars)
$ 62.03
$ 60.81
2 %
Total Revenue Per Unit Per Month
Total Revenues – adjusted for foreign currency
$ 1,729
$ 1,556
Average Rentable Vehicles (in whole units)
393,512
373,153
Total revenue per unit (in whole dollars)
$ 4,395
$ 4,169
Number of months in period (in whole units)
3
3
Total RPU Per Month (in whole dollars)
$ 1,465
$ 1,390
5 %
Vehicle Utilization
Transaction Days (in thousands)
27,879
25,579
Average Rentable Vehicles (in whole units)
393,512
373,153
Number of days in period (in whole units)
90
90
Available Car Days (in thousands)
35,420
33,584
Vehicle Utilization(b)
79 %
76 %
Depreciation Per Unit Per Month
Depreciation of revenue earning vehicles and lease charges, net
$ 349
$ (93)
Foreign currency adjustment(a)
1
—
Adjusted depreciation of revenue earning vehicles and lease charges
$ 350
$ (93)
Average Vehicles (in whole units)
412,983
397,620
Adjusted depreciation of revenue earning vehicles and lease charges divided by Average Vehicles (in whole dollars)
$ 847
$ (235)
Number of months in period (in whole units)
3
3
Depreciation Per Unit Per Month (in whole dollars)
$ 282
$ (78)
NM
NM – Not meaningful
(a) Based on December 31, 2022 foreign exchange rates.
(b) Calculated as Transaction Days divided by Available Car Days.
Supplemental Schedule V (continued)
HERTZ GLOBAL HOLDINGS, INC.
KEY METRICS CALCULATIONS
REVENUE, UTILIZATION AND DEPRECIATION
Unaudited
International RAC
Three Months Ended March 31,
Percent Inc/ (Dec)
($ in millions, except where noted)
2023
2022
Total RPD
Revenues
$ 317
$ 252
Foreign currency adjustment(a)
(3)
(15)
Total Revenues – adjusted for foreign currency
$ 314
$ 237
Transaction Days (in thousands)
5,908
5,042
Total RPD (in dollars)
$ 53.18
$ 47.00
13 %
Total Revenue Per Unit Per Month
Total Revenues – adjusted for foreign currency
$ 314
$ 237
Average Rentable Vehicles (in whole units)
89,776
82,364
Total revenue per unit (in whole dollars)
$ 3,500
$ 2,877
Number of months in period (in whole units)
3
3
Total RPU Per Month (in whole dollars)
$ 1,167
$ 959
22 %
Vehicle Utilization
Transaction Days (in thousands)
5,908
5,042
Average Rentable Vehicles (in whole units)
89,776
82,364
Number of days in period (in whole units)
90
90
Available Car Days (in thousands)
8,191
7,415
Vehicle Utilization (b)
72 %
68 %
Depreciation Per Unit Per Month
Depreciation of revenue earning vehicles and lease charges, net
$ 32
$ 34
Foreign currency adjustment(a)
(1)
(2)
Adjusted depreciation of revenue earning vehicles and lease charges
$ 31
$ 32
Average Vehicles (in whole units)
91,545
83,591
Adjusted depreciation of revenue earning vehicles and lease charges divided by Average Vehicles (in whole dollars)
$ 344
$ 386
Number of months in period (in whole units)
3
3
Depreciation Per Unit Per Month (in whole dollars)
$ 115
$ 129
(11) %
(a) Based on December 31, 2022 foreign exchange rates.
(b) Calculated as Transaction Days divided by Available Car Days.
NON-GAAP MEASURES AND KEY METRICS
The term "GAAP" refers to accounting principles generally accepted in the United States. Adjusted EBITDA is the Company’s segment measure of profitability and complies with GAAP when used in that context.
NON-GAAP MEASURES
Non-GAAP measures are not recognized measurements under GAAP. When evaluating the Company’s operating performance or liquidity, investors should not consider non-GAAP measures in isolation of, superior to, or as a substitute for measures of the Company’s financial performance as determined in accordance with GAAP.
Adjusted Net Income (Loss) and Adjusted Diluted Earnings (Loss) Per Share ("Adjusted EPS")
Adjusted Net Income (Loss) represents income or loss attributable to the Company as adjusted to eliminate the impact of GAAP income tax; vehicle and non-vehicle debt-related charges; restructuring and restructuring related charges; acquisition accounting-related depreciation and amortization; change in fair value of Public Warrants; unrealized (gains) losses on financial instruments, gain on sale of non-vehicle capital assets and certain other miscellaneous items on a pre-tax basis. Adjusted Net Income (Loss) includes a provision (benefit) for income taxes derived utilizing a combined statutory rate. The combined statutory rate is management’s estimate of the Company’s long-term tax rate. Its most comparable GAAP measure is net income (loss) attributable to the Company.
Adjusted EPS represents Adjusted Net Income (Loss) on a per diluted share basis using the weighted-average number of diluted shares outstanding for the period. Its most comparable GAAP measure is diluted earnings (loss) per share.
Adjusted Net Income (Loss) and Adjusted EPS are important operating metrics because they allow management and investors to assess operational performance of the Company’s business, exclusive of the items mentioned above that are not operational in nature or comparable to those of the Company’s competitors.
Adjusted Corporate EBITDA and Adjusted Corporate EBITDA Margin
Adjusted Corporate EBITDA represents income or loss attributable to the Company as adjusted to eliminate the impact of GAAP income tax; non-vehicle depreciation and amortization; non-vehicle debt interest, net; vehicle debt-related charges; restructuring and restructuring related charges; change in fair value of Public Warrants; unrealized (gains) losses on financial instruments; gain on sale of non-vehicle capital assets and certain other miscellaneous items.
Adjusted Corporate EBITDA Margin is calculated as the ratio of Adjusted Corporate EBITDA to total revenues.
Management uses these measures as operating performance metrics for internal monitoring and planning purposes, including the preparation of the Company’s annual operating budget and monthly operating reviews, and analysis of investment decisions, profitability and performance trends. These measures enable management and investors to isolate the effects on profitability of operating metrics most meaningful to the business of renting and leasing vehicles. They also allow management and investors to assess the performance of the entire business on the same basis as its reportable segments. Adjusted Corporate EBITDA is also utilized in the determination of certain executive compensation. Its most comparable GAAP measure is net income (loss) attributable to the Company.
Adjusted operating cash flow and adjusted free cash flow
Adjusted operating cash flow represents net cash provided by operating activities net of the non-cash add back for vehicle depreciation and reserves, and exclusive of bankruptcy related payments made post emergence. Adjusted operating cash flow is important to management and investors as it provides useful information about the amount of cash generated from operations when fully burdened by fleet costs.
Adjusted free cash flow represents adjusted operating cash flow plus the impact of net non-vehicle capital expenditures and net fleet growth after financing. Adjusted free cash flow is important to management and investors as it provides useful information about the amount of cash available for, but not limited to, the reduction of non-vehicle debt, share repurchase and acquisition.
The most comparable GAAP measure for adjusted operating cash flow and adjusted free cash flow is net cash provided by (used in) operating activities.
KEY METRICS
Available Rental Car Days
Available Rental Car Days represents Average Rentable Vehicles multiplied by the number of days in a given period.
Average Vehicles ("Fleet Capacity" or "Capacity")
Average Vehicles is determined using a simple average of the number of vehicles in the fleet whether owned or leased by the Company at the beginning and end of a given period.
Average Rentable Vehicles
Average Rentable Vehicles reflects Average Vehicles excluding vehicles for sale on the Company’s retail lots or actively in the process of being sold through other disposition channels.
Depreciation Per Unit Per Month ("Depreciation Per Unit" or "DPU")
Depreciation Per Unit Per Month represents the amount of average depreciation expense and lease charges per vehicle per month, exclusive of the impacts of foreign currency exchange rates so as not to affect the comparability of underlying trends. This metric is important to management and investors as it reflects how effectively the Company is managing the costs of its vehicles and facilitates comparisons with other participants in the vehicle rental industry.
Total Revenue Per Transaction Day ("Total RPD"or "RPD"; also referred to as "pricing")
Total RPD represents revenue generated per transaction day, excluding the impact of foreign currency exchange rates so as not to affect the comparability of underlying trends. This metric is important to management and investors as it represents a measure of changes in the underlying pricing in the vehicle rental business and encompasses the elements in vehicle rental pricing that management has the ability to control.
Total Revenue Per Unit Per Month ("Total RPU" or "Total RPU Per Month")
Total RPU Per Month represents the amount of revenue generated per vehicle in the rental fleet each month, excluding the impact of foreign currency exchange rates so as not to affect the comparability of underlying trends. This metric is important to management and investors as it provides a measure of revenue productivity relative to the number of vehicles in our rental fleet whether owned or leased, or asset efficiency.
Transaction Days ("Days"; also referred to as "volume")
Transaction Days represents the total number of 24-hour periods, with any partial period counted as one Transaction Day, that vehicles were on rent (the period between when a rental contract is opened and closed) in a given period. Thus, it is possible for a vehicle to attain more than one Transaction Day in a 24-hour period. This metric is important to management and investors as it represents the number of revenue-generating days.
Vehicle Utilization ("Utilization")
Vehicle Utilization represents the ratio of Transaction Days to Available Rental Car Days. This metric is important to management and investors as it is the measurement of the proportion of vehicles that are being used to generate revenues relative to rentable fleet capacity.
Hertz and City of Atlanta Launch Partnership to Expand Electric Vehicle Rentals, EV Charging Infrastructure and Education and Training Opportunities
ATLANTA, April 19, 2023 /PRNewswire/ — Hertz (NASDAQ: HTZ) chair and CEO Stephen Scherr and Mayor of Atlanta Andre Dickens launched Hertz Electrifies Atlanta, a public private partnership aimed at accelerating the adoption of electric vehicles (EVs) and expanding the environmental and economic benefits of electrification throughout Atlanta.
Hertz Chair and CEO Stephen Scherr and Mayor of Atlanta Andre Dickens shake hands at the launch of Hertz Electrifies Atlanta.
As part of the partnership, Hertz aims to bring up to an additional 4,000 rental EVs to Atlanta – including models from GM, Tesla and Polestar – for availability to leisure and business customers as well as rideshare drivers. In partnership with bp, Hertz will support the installation of up to eight public fast chargers at its Hertz Uber Rental and EV Charging Location near Hartfield-Jackson Atlanta International Airport. In addition, Hertz is partnering with Atlanta College and Career Academy (ACCA) to help bring EV education and training opportunities to its students and making summer job opportunities available through the city’s Summer Youth Employment Program.
"We are thrilled to partner with Mayor Dickens in launching Hertz Electrifies Atlanta, particularly given the city’s position as a global transportation hub and an important center of innovation and commerce," said Stephen Scherr, Hertz chair and CEO. "As Hertz creates the largest electric vehicle rental fleet in North America, we are proud to bring a range of EVs to our broad customer set in Atlanta, and to work with Atlanta College and Career Academy to help train the EV workforce of the future."
The initiative aligns with Mayor Dickens’s pledge to put Atlanta on track to meet City of Atlanta Historic Clean Energy Plan goals to transition to 100% clean energy by 2035. In addition, Hertz’s partnership with Atlanta College and Career Academy and participation in the Youth Employment Program underscores the Mayor’s Year of the Youth initiative.
"The City of Atlanta wants 100% clean energy for 100% of Atlantans by 2035, and public-private partnerships like the Hertz Electrifies Atlanta initiative will help us move closer to our goal," said Atlanta Mayor Andre Dickens. "This initiative will help ensure our students have access to a high-growth industry and be part of our green energy future."
Atlanta is home to Hertz’s third largest total fleet and third largest EV fleet in the U.S., which will expand significantly through Hertz Electrifies. Additionally, Atlanta is an important location for EV rideshare driving, through a partnership between Hertz and Uber. Nearly 50,000 drivers on the Uber platform have rented electric vehicles from Hertz through the partnership, traveling over 260 million miles with zero emissions nationally and 15 million miles with zero emissions in Atlanta. To support its growing rideshare business in Atlanta, Hertz is working with bp pulse to support the installation of publicly accessible EV fast-chargers at the Hertz Uber Rental and EV Charging Location near Hartfield-Jackson Atlanta International Airport.
"At Uber, we believe that climate change is an urgent global challenge we must all tackle together," said Bob Rupp, Director of Vehicle Operations, Uber. "Our partnership with Hertz is designed to accelerate the adoption of EVs across America, including right here in Atlanta. We’re excited to see even more electric vehicles on the road and look forward to working with industry partners, like Hertz, to find new, innovative, and affordable ways to help drivers in Atlanta go electric."
As part of its work with Atlanta College and Career Academy, Hertz is donating a Chevy Bolt and providing EV educational and training materials to enable the school to incorporate EV technology into its auto servicing curriculum.
"Access to hands-on experience with the latest technology is critical for Atlanta Public Schools scholars as we prepare them for careers we can’t even begin to imagine," said Atlanta Public Schools Superintendent Lisa Herring. "We are very thankful to partner with Hertz to bring an electric vehicle to our flagship auto servicing program at Atlanta College and Career Academy and look forward to working together to ensure students have the skills they need to succeed in the future."
Atlanta is the third City to partner with Hertz through Hertz Electrifies, as part of a multi-city rollout of this national public-private initiative.
About Hertz Electrifies Hertz Electrifies is a public-private partnership aimed at furthering the mainstream adoption of electric vehicles and extending the benefits of electrification to communities throughout the United States. Learn more at www.hertz.com/electrifies
About Hertz The Hertz Corporation, a subsidiary of Hertz Global Holdings, Inc., operates the Hertz, Dollar and Thrifty vehicle rental brands throughout North America, Europe, the Caribbean, Latin America, Africa, the Middle East, Asia, Australia and New Zealand. The Hertz Corporation is one of the largest worldwide vehicle rental companies, and the Hertz brand is one of the most recognized globally. Additionally, The Hertz Corporation operates the Firefly vehicle rental brand and Hertz 24/7 car sharing business in international markets and sells vehicles through Hertz Car Sales. For more information about The Hertz Corporation, visit www.hertz.com. Hertz has tens of thousands of EVs available at more than 500 Hertz locations across 38 states.
About The City of Atlanta For more information about the City of Atlanta, please visit www.atlantaga.gov or watch City Channel 26. Follow the City of Atlanta on Facebook and Twitter @CityofAtlanta.
About Uber Uber’s mission is to create opportunity through movement. We started in 2010 to solve a simple problem: how do you get access to a ride at the touch of a button? More than 37 billion trips later, we’re building products to get people closer to where they want to be. By changing how people, food, and things move through cities, Uber is a platform that opens up the world to new possibilities.
About bp bp’s ambition is to become a net zero company by 2050 or sooner, and to help the world get to net zero. bp has a larger economic footprint in the United States than anywhere else in the world, investing more than $140 billion since 2005 and supporting about 245,000 jobs. For more information on bp in the US, visit www.bp.com/US.
About bp pulse bp pulse is bp’s electric vehicle (EV) charging business, rolling out fast, reliable charge points to consumers and commercial fleets around the world. Entering into the Americas, bp pulse focuses on providing EV charging and energy management to fleets that operate heavy-, medium- and light-duty vehicles. Key offerings for these fleets include intelligent charge management software, Omega, and a Charging-as-a-Service solution–allowing bp pulse to manage the charging of an EV fleet from start to finish, while optimizing energy costs and vehicle utilization. Globally, bp pulse is one of the UK’s leading rapid and ultrafast public EV charging networks. It also operates the largest number of sites with ultra-fast charging in Germany, with a growing charging point footprint in China and the Netherlands. The company aims to increase its network of public EV charging points by 2030 to over 100,000 worldwide.
About Atlanta Public Schools Atlanta Public Schools is one of the largest school districts in the state of Georgia, serving approximately 50,000 students across 87 schools and five programs. The District is organized into nine K-12 clusters with 64 traditional schools, 19 charter schools, six partner schools, two alternative schools and five alternative programs. To learn more about Atlanta Public Schools, follow us on social media – Twitter (@apsupdate), Facebook (Atlanta Public Schools), and Instagram (apsupdate) – or visit us online at www.atlantapublicschools.us.
Cautionary Note Concerning Forward-Looking Statements This press release contains "forward-looking statements" within the meaning of the federal securities laws. Words such as "aim," "create," "accelerate," "transition," "will," "build," "future," "transform," "invest," "shift," "launch," "increase," "initiative," "expand," add," and "develop," and similar expressions identify forward-looking statements, which include but are not limited to statements related to the expansion of Hertz’s EV fleet and its partnership with Uber, installation of charging infrastructure including in partnership with bp, and any other statements regarding future expectations, beliefs, plans, objectives, future events or performance. We caution you that these statements are not guarantees of future performance and are subject to numerous evolving risks and uncertainties that we may not be able to accurately predict or assess, including Hertz’s ability to expand its EV fleet, develop and install sufficient EV charging infrastructure, and otherwise execute on its strategic plans, as well as other factors identified in the risk factors of Hertz’s Annual Report on Form 10-K for the year ended December 31, 2021, as filed with the Securities and Exchange Commission (the "SEC") on February 23, 2022 and any updates thereto in subsequent filings with the SEC including in Hertz’s Quarterly Reports on Form 10-Q. We caution you not to place undue reliance on our forward-looking statements, which speak only as of their date, and Hertz undertakes no obligation to update this information.
ESTERO, Fla., April 3, 2023 /PRNewswire/ — Hertz Global Holdings, Inc. (NASDAQ: HTZ) (the "Company") announced today that it plans to report its first quarter 2023 financial results at approximately 7:30 a.m. ET on Thursday, April 27, 2023 followed by an earnings call at 8:30 a.m. ET.
A live webcast of the call will be available on the Investor Relations page of the Company’s website at https://ir.hertz.com. To access the call by phone, please register through this link Hertz Q1 2023 earnings teleco registration and you will be provided with dial in details. To avoid delays, we encourage participants to dial into the conference call fifteen minutes ahead of the scheduled start time. A web replay will remain available on the website for approximately one year.
ABOUT HERTZ
The Hertz Corporation, a subsidiary of Hertz Global Holdings, Inc., operates the Hertz, Dollar and Thrifty vehicle rental brands throughout North America, Europe, the Caribbean, Latin America, Africa, the Middle East, Asia, Australia and New Zealand. The Hertz Corporation is one of the largest worldwide vehicle rental companies, and the Hertz brand is one of the most recognized globally. Additionally, The Hertz Corporation operates the Firefly vehicle rental brand and Hertz 24/7 car sharing business in international markets and sells vehicles through Hertz Car Sales.
ESTERO, Fla., March 27, 2023 /PRNewswire/ — Hertz Global Holdings, Inc. (Nasdaq: HTZ) today announced that it has appointed Alexandra Brooks, its Chief Accounting Officer, as interim Chief Financial Officer effective April 1, 2023. Ms. Brooks will replace Kenny Cheung, who is leaving the company to pursue another professional opportunity in a different industry.
Hertz is initiating a formal search process for the selection of its permanent Chief Financial Officer. Mr. Cheung will remain at the company until April 14, 2023, to support the first quarter financial closing process and ensure an orderly transition to Ms. Brooks.
"I would like to thank Kenny for his contributions to Hertz and we wish him the best in his future endeavors," said Stephen Scherr, Chair and Chief Executive Officer of Hertz.
"It has been a privilege to be the CFO of Hertz over the last two and a half years and to close my career at the company on a positive note at the end of this quarter," said Kenny Cheung. "I am confident that under Stephen’s leadership, Hertz is well-positioned to deliver on its strategic priorities and create long-term value for shareholders."
About Hertz The Hertz Corporation, a subsidiary of Hertz Global Holdings, Inc., operates the Hertz, Dollar and Thrifty vehicle rental brands throughout North America, Europe, the Caribbean, Latin America, Africa, the Middle East, Asia, Australia and New Zealand. The Hertz Corporation is one of the largest worldwide vehicle rental companies, and the Hertz brand is one of the most recognized globally. Additionally, The Hertz Corporation operates the Firefly vehicle rental brand and Hertz 24/7 car sharing business in international markets and sells vehicles through Hertz Car Sales. For more information about The Hertz Corporation, visit www.hertz.com.
Hertz aims to add EVs to Houston fleet and support bp’s installation of a publicly accessible EV fast-charging hub at the Hertz location at Houston Hobby Airport
HOUSTON, March 7, 2023 /PRNewswire/ — Hertz (NASDAQ: HTZ) chair and CEO Stephen Scherr and Houston Mayor Sylvester Turner launched Hertz ElectrifiesHouston and announced intentions to expand the availability of electric vehicles (EVs), charging infrastructure, and EV education and training opportunities in Houston. The initiative aligns with Mayor Turner’s Houston Climate Action Plan – a strategy that sets out to reduce greenhouse gas emissions, improve regional air quality, and build climate resilience.
"We are excited to partner with Mayor Turner and Evolve Houston to bring Hertz Electrifies to the Energy Capital of the World, and to expand charging capacity for our customers and the broader community," said Stephen Scherr, Hertz chair and CEO. "As Hertz creates the largest EV rental fleet in North America, we look forward to working with the city, Lone Star College-North Harris and other organizations to expand the benefits of electrification in the Houston community."
Hertz aims to bring over 2,100 rental EVs to Houston, nearly tripling its existing EV fleet in the city – including models from Tesla, Polestar, and GM – for availability to leisure and business customers as well as rideshare drivers. In partnership with bp pulse, Hertz will support the installation of a large, EV fast-charging hub designed to serve ride-hail, taxi fleets, and the general public at the Hertz location at Houston Hobby airport.
"Our goal is to convert all non-emergency, light-duty municipal vehicles to electric by 2030. This partnership with Hertz will provide an invaluable boost to achieve this goal and the goal of our Climate Action Plan for Houston to be a net-zero city by 2050," said Houston Mayor Sylvester Turner. "Electrification can benefit every community in Houston. We’re proud to work with Hertz and bp pulse to build up electric fleets and charging infrastructure and bring education and training that will provide new opportunities to all Houstonians."
"Reliable, fast-charging options are critical to scale EV adoption in America and we are thrilled to work with Hertz to bring fast charging to the Houston community. Along with our partnership with Hertz to develop a Gigahub site at their Houston Hobby Airport location, we are also developing a charging hub at bp’s corporate HQ campus in Houston that will be open to the public," said Vic Shao, President of bp pulse fleet. "We look forward to bringing more fast-charging options to more Americans, and closing the infrastructure gap that is hindering wide scale EV adoption."
To help inform the buildout of charging infrastructure across all neighborhoods of Houston, Hertz is sharing with the city anonymous, aggregated telematic insights from its fleet of connected cars through the "Hertz Charging Opportunity Index."
"The Greater Houston area has made significant progress in meeting electrification goals," said Casey Brown, President and Executive Director of Evolve Houston. "We think that the Hertz Electrifies partnership with the city will help grow the electric vehicle sector in Houston and look forward to leveraging shared insights to continue to expand charging infrastructure across all Houston communities."
Hertz is donating an electric vehicle and providing EV educational and training materials to Lone Star College-North Harris to enable the school to incorporate EV technology into its auto servicing curriculum. Hertz is also making summer jobs available to young people in Houston, including through the Hire Houston Youth Summer Jobs program.
"Lone Star College-North Harris houses one of top automotive programs in Texas," said Lone Star College-North Harris President Dr. Archie L. Blanson. "To make our students competitive and meet industry demand, we must ensure we are bringing the latest technologies, including a diversified fleet of EVs into the classroom. We are glad to fulfill students’ academic needs through our partnership with Hertz and Houston. Together we will continue working to ensure that our students are prepared for the jobs and technologies of the future."
Houston is the second city to partner with Hertz in this new initiative that will soon expand to other cities across the country to create economic opportunity and environmental benefits for communities.
About Hertz Electrifies Hertz Electrifies is a new public-private partnership aimed at furthering the mainstream adoption of electric vehicles and extending the benefits of electrification to communities throughout the United States. The initiative has five pillars: (1) electric vehicle and charging infrastructure; (2) creating jobs of the future; (3) broadening economic opportunity; (4) community engagement; and (5) policy and city planning analysis.
About Hertz The Hertz Corporation, a subsidiary of Hertz Global Holdings, Inc., operates the Hertz, Dollar and Thrifty vehicle rental brands throughout North America, Europe, the Caribbean, Latin America, Africa, the Middle East, Asia, Australia and New Zealand. The Hertz Corporation is one of the largest worldwide vehicle rental companies, and the Hertz brand is one of the most recognized globally. Additionally, The Hertz Corporation operates the Firefly vehicle rental brand and Hertz 24/7 car sharing business in international markets and sells vehicles through Hertz Car Sales. For more information about The Hertz Corporation, visit www.hertz.com. Hertz has tens of thousands of EVs available at more than 500 Hertz locations across 38 states.
About The City of Houston The City of Houston is a large metropolis in Texas and home to over 2 million residents. As the Energy Capital of the World, Houston is the headquarters and the intellectual capital for virtually every segment of the energy industry including exploration, production, transmission, marketing, supply, and technology. Houston employs nearly a third of the nation’s jobs in oil and gas extraction. Home to a vibrant economy, beautiful surroundings and a population full of optimism and spirit, it’s no wonder that Houston is a popular international destination.
About bp bp’s ambition is to become a net zero company by 2050 or sooner, and to help the world get to net zero. bp has a larger economic footprint in the United States than anywhere else in the world, investing more than $140 billion since 2005 and supporting about 245,000 jobs. For more information on bp in the US, visit www.bp.com/US.
About bp pulse bp pulse is bp’s electric vehicle (EV) charging business, rolling out fast, reliable charge points to consumers and commercial fleets around the world. Entering into the Americas, bp pulse focuses on providing EV charging and energy management to fleets that operate heavy-, medium- and light-duty vehicles. Key offerings for these fleets include intelligent charge management software, Omega, and a Charging-as-a-Service solution–allowing bp pulse to manage the charging of an EV fleet from start to finish, while optimizing energy costs and vehicle utilization. Globally, bp pulse is one of the UK’s leading rapid and ultrafast public EV charging networks. It also operates the largest number of sites with ultra-fast charging in Germany, with a growing charging point footprint in China and the Netherlands. The company aims to increase its network of public EV charging points by 2030 to over 100,000 worldwide.
About Evolve Houston Evolve Houston is a coalition of sustainability-minded civic, business, and academic leaders who seek to accelerate clean transportation through electrification. Collaborating with government, academic, private industry, and community leaders, our goal is to improve regional air quality and reduce greenhouse gas emissions in the Greater Houston area.
Cautionary Note Concerning Forward-Looking Statements This press release contains "forward-looking statements" within the meaning of the federal securities laws. Words such as "aim," "create," "accelerate," "transition," "will," "build," "future," "transform," "invest," "shift," "launch," "increase," "initiative," "expand," add," and "develop," and similar expressions identify forward-looking statements, which include but are not limited to statements related to the expansion of Hertz’s EV fleet and its partnership with Uber, installation of charging infrastructure including in partnership with bp, and any other statements regarding future expectations, beliefs, plans, objectives, future events or performance. We caution you that these statements are not guarantees of future performance and are subject to numerous evolving risks and uncertainties that we may not be able to accurately predict or assess, including Hertz’s ability to expand its EV fleet, develop and install sufficient EV charging infrastructure, and otherwise execute on its strategic plans, as well as other factors identified in the risk factors of Hertz’s Annual Report on Form 10-K for the year ended December 31, 2021, as filed with the Securities and Exchange Commission (the "SEC") on February 23, 2022 and any updates thereto in subsequent filings with the SEC including in Hertz’s Quarterly Reports on Form 10-Q. We caution you not to place undue reliance on our forward-looking statements, which speak only as of their date, and Hertz undertakes no obligation to update this information.
Partnership with Montbello Career and Technical High School
Jumpstarts Training for Jobs of the Future
DENVER, March 3, 2023 /PRNewswire/ — Hertz (NASDAQ: HTZ) Chair and CEO Stephen Scherr and Denver Mayor Michael Hancock launched Hertz Electrifies in Denver at Montbello Career and Technical High School and announced intentions to expand the availability of electric vehicles (EVs), charging infrastructure, and EV education and training opportunities in the Denver community. Denver is the first city in this new public private initiative with Hertz, which is expanding to other cities across the country.
"Hertz is investing in the largest electric vehicle rental fleet in North America and as part of that effort, we are committed to helping communities tap into the economic and environmental benefits of electrification," said Hertz CEO Stephen Scherr. "We are proud to launch Hertz Electrifies with the city of Denver and Mayor Hancock, and to partner with Montbello Career and Technical High School to help create EV educational and training opportunities for the workforce of the future."
Through Hertz Electrifies, Hertz aims to bring up to 5,200 rental EVs to Denver – including models from Tesla, Polestar, and GM – for availability to leisure and business travelers as well as rideshare drivers. In addition, Hertz is supporting the installation of publicly accessible charging infrastructure in partnership with bp and its global high-speed electric charging network, bp pulse. To help inform the buildout of charging infrastructure across all neighborhoods of Denver, Hertz is sharing with the city anonymous, aggregated telematic insights from its fleet of connected cars through its "Hertz Charging Opportunity Index."
Hertz is donating an electric vehicle and providing EV educational and training materials to Montbello Career and Technical High School to enable the school to incorporate EV technology into its auto servicing curriculum. Hertz is also making summer jobs available to young people in Denver, including through the Denver Youth Employment Program.
"Our partnership with Hertz and their donation of resources and an EV to Montbello Career and Technical High School is a groundbreaking new endeavor to teach young people new skills and prepare them for the next wave of technological advances," said Denver Mayor Michael B. Hancock. "We’re targeting this initial effort right where it’s most needed, and also partnering with the Denver Youth Employment Program to make sure there are similar opportunities across the city. These alliances will further educate our youth and put them on a path to success in the economy of tomorrow."
"At bp we know it’s going to take a high level of coordination to transition to a net zero future," said Denver native and bp America chairman and president Dave Lawler. "These public private partnerships are important, and equally important is engaging students early and often to ensure they have the right skills for the future. We can’t do it without them. I commend Mayor Hancock and Hertz as we continue to make steady progress in Denver."
"Montbello Career and Technical houses the only high school automotive program in the far northeast region of Denver," said Arnetta Koger, Principal of Montbello Career and Technical High School. "We are glad to partner with Hertz and Denver. Now, with our first electric vehicle, we will be able to ensure that our students are preparing for the jobs and technologies of the future."
In January, Hertz announced Hertz Electrifies, a new public-private partnership aimed at accelerating the transition to electric vehicles, while creating economic opportunity and environmental benefits for communities. In addition, Hertz and bp have announced an intention to bring fast charging infrastructure to Hertz locations in major cities, including Denver.
About Hertz Electrifies Hertz Electrifies is a new public-private partnership aimed at furthering the mainstream adoption of electric vehicles and extending the benefits of electrification to communities throughout the United States. The initiative has five pillars: (1) electric vehicle and charging infrastructure; (2) creating jobs of the future; (3) broadening economic opportunity; (4) community engagement; and (5) policy and city planning analysis.
About Hertz The Hertz Corporation, a subsidiary of Hertz Global Holdings, Inc., operates the Hertz, Dollar and Thrifty vehicle rental brands throughout North America, Europe, the Caribbean, Latin America, Africa, the Middle East, Asia, Australia and New Zealand. The Hertz Corporation is one of the largest worldwide vehicle rental companies, and the Hertz brand is one of the most recognized globally. Additionally, The Hertz Corporation operates the Firefly vehicle rental brand and Hertz 24/7 car sharing business in international markets and sells vehicles through Hertz Car Sales. For more information about The Hertz Corporation, visit www.hertz.com. Hertz has tens of thousands of EVs available at more than 500 Hertz locations across 38 states.
About The City of Denver The City of Denver is the capital of Colorado and home to over 700,000 residents. Known as the Mile High City for its 5,280-foot elevation, Denver serves as the gateway to the Rocky Mountains and is home to one of the largest city park systems in the country. Under Mayor Hancock’s leadership, Denver has become known as a top U.S. city for startups and entrepreneurship, especially for minority and women-owned businesses, one of the best places to live and is working to make sure that all residents, no matter which background they represent, can experience the success that Denver has experienced.
About bp bp’s ambition is to become a net zero company by 2050 or sooner, and to help the world get to net zero. bp has a larger economic footprint in the United States than anywhere else in the world, investing more than $140 billion since 2005 and supporting about 245,000 jobs. For more information on bp in the US, visit www.bp.com/US.
About bp pulse bp pulse is bp’s electric vehicle (EV) charging business, rolling out fast, reliable charge points to consumers and commercial fleets around the world. Entering into the Americas, bp pulse focuses on providing EV charging and energy management to fleets that operate heavy-, medium- and light-duty vehicles. Key offerings for these fleets include intelligent charge management software, Omega, and a Charging-as-a-Service solution–allowing bp pulse to manage the charging of an EV fleet from start to finish, while optimizing energy costs and vehicle utilization. Globally, bp pulse is one of the UK’s leading rapid and ultrafast public EV charging networks. It also operates the largest number of sites with ultra-fast charging in Germany, with a growing charging point footprint in China and the Netherlands. The company aims to increase its network of public EV charging points by 2030 to over 100,000 worldwide.
Cautionary Note Concerning Forward-Looking Statements This press release contains "forward-looking statements" within the meaning of the federal securities laws. Words such as "aim," "create," "accelerate," "transition," "will," "build," "future," "transform," "invest," "shift," "launch," "increase," "initiative," "expand," add," and "develop," and similar expressions identify forward-looking statements, which include but are not limited to statements related to the expansion of Hertz’s EV fleet and its partnership with Uber, installation of charging infrastructure including in partnership with bp, and any other statements regarding future expectations, beliefs, plans, objectives, future events or performance. We caution you that these statements are not guarantees of future performance and are subject to numerous evolving risks and uncertainties that we may not be able to accurately predict or assess, including Hertz’s ability to expand its EV fleet, develop and install sufficient EV charging infrastructure, and otherwise execute on its strategic plans, as well as other factors identified in the risk factors of Hertz’s Annual Report on Form 10-K for the year ended December 31, 2021, as filed with the Securities and Exchange Commission (the "SEC") on February 23, 2022 and any updates thereto in subsequent filings with the SEC including in Hertz’s Quarterly Reports on Form 10-Q. We caution you not to place undue reliance on our forward-looking statements, which speak only as of their date, and Hertz undertakes no obligation to update this information.
"Our strong results in the fourth quarter and record performance last year reflect a commitment to customers – from leisure and corporate travelers to ride share drivers. With a focus on asset return and risk management, we showed better operating performance, more disciplined fleet management and a commitment to financial returns," said Stephen Scherr, Hertz chair and chief executive officer. "Our team delivered on renewed demand for travel, which is continuing. In 2023, we will build on our progress to grow our business across the Hertz, Dollar, and Thriftybrands. We look to our investments in electrification and technology to yield increasing operating leverage and improved returns and an even better product to our customers around the world."
ESTERO, Fla., Feb. 7, 2023 /PRNewswire/ — Hertz Global Holdings, Inc. (NASDAQ: HTZ) ("Hertz", "Hertz Global" or the "Company") today reported results for its fourth quarter and full year 2022.
For the fourth quarter 2022, the Company generated total revenues of $2.0 billion, up 4% from the fourth quarter of 2021, and up 7% on a constant currency basis. RPD and RPU were at fourth quarter record levels and volume was up 3% led by post-pandemic demand recovery. Depreciation continued to normalize during the quarter. Excluding litigation settlements of $168 million in the quarter, direct operating expense per transaction day was $33, down $2 from the third quarter 2022, demonstrating improved operating leverage. Net income was $116 million and Adjusted Corporate EBITDA was $309 million, a 15% margin. For the quarter, loss per share was $0.01 and adjusted earnings per share was $0.50.
Operating cash flow was $277 million for the quarter. Fleet capex of $312 million was a source of cash in the fourth quarter, driven by fleet rejuvenation and seasonal defleeting. As a result, adjusted free cash flow was $424 million, reflecting a 137% conversion from Adjusted Corporate EBITDA. The Company acquired 19 million shares, or 6% of its common stock, during the quarter.
HIGHLIGHTS
Q4 2022
Revenue of $2.0 billion
GAAP net income of $116 million, or $(0.01) per diluted share
Adjusted net income of $173 million, or $0.50 per diluted share
Adjusted Corporate EBITDA of $309 million, a 15% margin
Operating cash flow of $277 million
Adj. operating cash flow of $156 million; adj. free cash flow of $424 million
FY 2022
Revenue of $8.7 billion
Record GAAP net income of $2.1 billion, or $3.36 per diluted share
Record adjusted net income of $1.5 billion, or $3.74 per diluted share
Record Adjusted Corporate EBITDA of $2.3 billion, a 27% margin
Operating cash flow of $2.5 billion
Record adj. operating cash flow of $2.0 billion and adj. free cash flow of $1.5 billion
Corporate liquidity of $2.5 billion at December 31st, including $943 million in unrestricted cash
Company repurchased 128 million common shares during 2022, a 28.5% reduction of its capital base
SUMMARY RESULTS
Three Months Ended
December 31,
Percent Inc/(Dec)
2022 vs 2021
($ in millions, except earnings per share or where noted)
2022
2021
Hertz Global – Consolidated
Total revenues
$ 2,035
$ 1,949
4 %
Adjusted net income (loss)(a)
$ 173
$ 426
(59) %
Adjusted diluted earnings (loss) per share(a)
$ 0.50
$ 0.91
(45) %
Adjusted Corporate EBITDA(a)
$ 309
$ 628
(51) %
Adjusted Corporate EBITDA Margin(a)
15 %
32 %
Average Vehicles (in whole units)
496,926
470,900
6 %
Average Rentable Vehicles (in whole units)
465,943
454,000
3 %
Vehicle Utilization
79 %
78 %
Transaction Days (in thousands)
33,673
32,551
3 %
Total RPD (in dollars)(b)
$ 61.65
$ 59.80
3 %
Total RPU Per Month (in whole dollars)(b)
$ 1,485
$ 1,429
4 %
Depreciation Per Unit Per Month (in whole dollars)(b)
$ 244
$ 55
NM
Americas RAC Segment
Total revenues
$ 1,707
$ 1,691
1 %
Adjusted EBITDA
$ 318
$ 653
(51) %
Adjusted EBITDA Margin
19 %
39 %
Average Vehicles (in whole units)
398,860
384,492
4 %
Average Rentable Vehicles (in whole units)
370,723
368,434
1 %
Vehicle Utilization
80 %
80 %
Transaction Days (in thousands)
27,367
27,215
1 %
Total RPD (in dollars)(b)
$ 62.50
$ 62.11
1 %
Total RPU Per Month (in whole dollars)(b)
$ 1,538
$ 1,529
1 %
Depreciation Per Unit Per Month (in whole dollars)(b)
$ 278
$ 26
NM
International RAC Segment
Total revenues
$ 328
$ 258
27 %
Adjusted EBITDA
$ 81
$ 21
NM
Adjusted EBITDA Margin
25 %
8 %
Average Vehicles (in whole units)
98,065
86,408
13 %
Average Rentable Vehicles (in whole units)
95,221
85,565
11 %
Vehicle Utilization
72 %
68 %
Transaction Days (in thousands)
6,305
5,335
18 %
Total RPD (in dollars)(b)
$ 57.98
$ 48.01
21 %
Total RPU Per Month (in whole dollars)(b)
$ 1,280
$ 998
28 %
Depreciation Per Unit Per Month (in whole dollars)(b)
$ 104
$ 184
(44) %
NM – Not meaningful
(a)
Represents a non-GAAP measure. See the accompanying reconciliations included in Supplemental Schedule II for 2022 and 2021.
(b)
Based on December 31, 2021 foreign exchange rates.
LIQUIDITY AND CAPITAL RESOURCES
In December 2022, the Company amended its European ABS facility to add the fleet in Italy, increase aggregate maximum borrowings to €1.1 billion and extend the maturity from October 2023 to November 2024.
During the fourth quarter 2022, the Company repurchased 19 million shares for $315 million and has over $1.1 billion remaining under the Board’s authorization.
The Company’s liquidity position was $2.5 billion at December 31, 2022, of which $943 million was unrestricted cash.
EARNINGS WEBCAST INFORMATION
Hertz Global’s live webcast and conference call to discuss its fourth quarter and full year 2022 results will be held on February 7, 2023, at 8:30 a.m. Eastern Time. The conference call will be broadcast live in listen-only mode on the Company’s investor relations website at IR.Hertz.com. If you would like to access the call by phone and ask a question, please go to https://register.vevent.com/register/BI78420368890940eab75ec4e147ae0783, and you will be provided with dial in details. Investors are encouraged to dial-in approximately 15 minutes prior to the call. A web replay will remain available on the website for approximately one year. The earnings release and related supplemental schedules containing the reconciliations of non-GAAP measures will be available on the Hertz website, IR.Hertz.com.
UNAUDITED FINANCIAL DATA, SUPPLEMENTAL SCHEDULES, NON-GAAP MEASURES AND DEFINITIONS
Following is selected financial data of Hertz Global. Also included are Supplemental Schedules, which are provided to present segment results, and reconciliations of non-GAAP measures to their most comparable GAAP measure. Following the Supplemental Schedules, the Company provides definitions for terminology used throughout the earnings release and its view of the usefulness of non-GAAP measures to investors and management.
In the first quarter of 2022, the Company began using Average Rentable Vehicles when calculating Available Car Days, Total RPU and Utilization instead of Average Vehicles. Average Rentable Vehicles excludes vehicles for sale on the Company’s retail lots or actively in the process of being sold through other disposition channels. Prior periods have been restated to conform with the revisions, as appropriate. The Company has also restated historical quarterly and annual periods beginning with first quarter 2018 to reflect this change and has posted this information to its investor relations website at IR.Hertz.com.
ABOUT HERTZ
The Hertz Corporation, a subsidiary of Hertz Global Holdings, Inc., operates the Hertz, Dollar and Thrifty vehicle rental brands throughout North America, Europe, the Caribbean, Latin America, Africa, the Middle East, Asia, Australia and New Zealand. The Hertz Corporation is one of the largest worldwide vehicle rental companies, and the Hertz brand is one of the most recognized globally. Additionally, The Hertz Corporation owns and operates the Firefly vehicle rental brand and Hertz 24/7 car sharing business in international markets and sells vehicles through Hertz Car Sales. For more information about The Hertz Corporation, visit www.hertz.com.
Certain statements contained or incorporated by reference in this release, and in related comments by the Company’s management, include "forward-looking statements." Forward-looking statements include information concerning the Company’s liquidity and its possible or assumed future results of operations, including descriptions of its business strategies. These statements often include words such as "believe," "expect," "project," "potential," "anticipate," "intend," "plan," "estimate," "seek," "will," "may," "would," "should," "could," "forecasts," "guidance" or similar expressions. These statements are based on certain assumptions that the Company has made in light of its experience in the industry as well as its perceptions of historical trends, current conditions, expected future developments and other factors it believes are appropriate in these circumstances. The Company believes these judgments are reasonable, but you should understand that these statements are not guarantees of performance or results, and that the Company’s actual results could differ materially from those expressed in the forward-looking statements due to a variety of important factors, both positive and negative, that may be revised or supplemented in subsequent reports on Form 10-K, 10-Q and 8-K filed or furnished to the SEC.
Important factors that could affect the Company’s actual results and cause them to differ materially from those expressed in forward-looking statements include, among other things:
the Company’s ability to purchase adequate supplies of competitively priced vehicles at a reasonable cost in order to efficiently service rental demand, including as a result of disruptions in the global supply chain;
the Company’s ability to attract and retain effective frontline employees and senior management and other key employees;
levels of travel demand, particularly business and leisure travel in the U.S. and in global markets;
significant changes in the competitive environment and the effect of competition in the Company’s markets on rental volume and pricing;
occurrences that disrupt rental activity during the Company’s peak periods including in critical geographies;
the Company’s ability to accurately estimate future levels of rental activity and adjust the number and mix of vehicles used in its rental operations accordingly;
the Company’s ability to implement its business strategy or strategic transactions, including its ability to implement plans to support a large scale electric vehicle fleet and to play a central role in the modern mobility ecosystem;
the Company’s ability to adequately respond to changes in technology impacting the mobility industry;
the mix of program and non-program vehicles in the Company’s fleet can lead to increased exposure to residual risk upon disposition;
financial instability of the manufacturers of the Company’s vehicles, which could impact their ability to fulfill obligations under repurchase or guaranteed depreciation programs;
an increase in the Company’s vehicle costs or disruption to its rental activity due to safety recalls by the manufacturers of its vehicles;
the Company’s access to third-party distribution channels and related prices, commission structures and transaction volumes;
the Company’s ability to offer an excellent customer experience, retain and increase customer loyalty and market share;
the Company’s ability to maintain its network of leases and vehicle rental concessions at airports and other key locations in the U.S. and internationally;
the Company’s ability to maintain favorable brand recognition and a coordinated branding and portfolio strategy;
the Company’s ability to effectively manage its union relations and labor agreement negotiations;
the Company’s ability, and that of its key third-party partners, to prevent the misuse or theft of information the Company possesses, including as a result of cyber security breaches and other security threats, as well as to comply with privacy regulations across the globe;
a major disruption in the Company’s communication or centralized information networks or a failure to maintain, upgrade and consolidate its information technology systems;
risks associated with operating in many different countries, including the risk of a violation or alleged violation of applicable anti-corruption or anti-bribery laws and the Company’s ability to repatriate cash from non-U.S. affiliates without adverse tax consequences;
risks relating to tax laws, including those that affect the Company’s ability to recapture accelerated tax depreciation and expensing, as well as any adverse determinations or rulings by tax authorities;
the Company’s ability to utilize its net operating loss carryforwards;
the Company’s exposure to uninsured liabilities relating to personal injury, death and property damage, or otherwise;
changes in laws, regulations, policies or other activities of governments, agencies and similar organizations, including those related to accounting principles, that affect the Company’s operations, its costs or applicable tax rates;
the recoverability of the Company’s goodwill and indefinite-lived intangible assets when performing impairment analysis;
costs and risks associated with potential litigation and investigations, compliance with and changes in laws and regulations and potential exposures under environmental laws and regulations;
the Company’s ability to comply with ESG regulations, meet increasing ESG expectations of stakeholders, and otherwise achieve its ESG goals;
the availability of additional or continued sources of financing at acceptable rates for the Company’s revenue earning vehicles and to refinance its existing indebtedness;
volatility in the Company’s stock price and certain provisions of its charter documents which could negatively affect the market price of the Company’s common stock;
the Company’s ability to effectively maintain effective internal controls over financial reporting; and
the Company’s ability to implement an effective business continuity plan to protect the business in exigent circumstances.
Additional information concerning these and other factors can be found in the Company’s filings with the SEC, including its Annual Reports on Form 10-K, Quarterly Reports on Form 10-Q and Current Reports on Form 8-K.
You should not place undue reliance on forward-looking statements. All forward-looking statements attributable to the Company or persons acting on its behalf are expressly qualified in their entirety by the foregoing cautionary statements. All such statements speak only as of the date of this release, and, except as required by law, the Company undertakes no obligation to update or revise publicly any forward-looking statements, whether as a result of new information, future events or otherwise.
UNAUDITED FINANCIAL INFORMATION
UNAUDITED CONSOLIDATED STATEMENTS OF OPERATIONS
Three Months Ended
December 31,
Twelve Months Ended December 31,
(In millions, except per share data)
2022
2021
2022
2021
Revenues
$ 2,035
$ 1,949
$ 8,685
$ 7,336
Expenses:
Direct vehicle and operating
1,274
1,065
4,808
3,920
Depreciation of revenue earning vehicles and lease charges, net
360
78
701
497
Non-vehicle depreciation and amortization
37
43
142
196
Selling, general and administrative
221
188
959
688
Interest expense, net:
Vehicle
82
41
159
284
Non-vehicle
46
28
169
185
Total interest expense, net
128
69
328
469
Other (income) expense, net
8
(1)
2
(21)
Reorganization items, net
—
—
—
677
(Gain) from the sale of a business
—
—
—
(400)
Change in fair value of Public Warrants
(120)
643
(704)
627
Total expenses
1,908
2,085
6,236
6,653
Income (loss) before income taxes
127
(136)
2,449
683
Income tax (provision) benefit
(11)
(125)
(390)
(318)
Net income (loss)
116
(261)
2,059
365
Net (income) loss attributable to noncontrolling interests
—
1
—
1
Net income (loss) attributable to Hertz Global
116
(260)
2,059
366
Series A Preferred Stock deemed dividends
—
(450)
—
(450)
Net income (loss) available to Hertz Global common stockholders
$ 116
$ (710)
$ 2,059
$ (84)
Weighted average number of shares outstanding:
Basic
332
468
379
315
Diluted
347
468
403
315
Earnings (loss) per share:
Basic
$ 0.35
$ (1.52)
$ 5.43
$ (0.27)
Diluted
$ (0.01)
$ (1.52)
$ 3.36
$ (0.27)
UNAUDITED CONSOLIDATED BALANCE SHEETS
(In millions, except par value and share data)
December 31, 2022
December 31, 2021
ASSETS
Cash and cash equivalents
$ 943
$ 2,258
Restricted cash and cash equivalents:
Vehicle
180
77
Non-vehicle
295
316
Total restricted cash and cash equivalents
475
393
Total cash and cash equivalents and restricted cash and cash equivalents
1,418
2,651
Receivables:
Vehicle
111
62
Non-vehicle, net of allowance of $45 and $48, respectively
863
696
Total receivables, net
974
758
Prepaid expenses and other assets
1,155
1,017
Revenue earning vehicles:
Vehicles
14,281
10,836
Less: accumulated depreciation
(1,786)
(1,610)
Total revenue earning vehicles, net
12,495
9,226
Property and equipment, net
637
608
Operating lease right-of-use assets
1,887
1,566
Intangible assets, net
2,887
2,912
Goodwill
1,044
1,045
Total assets
$ 22,497
$ 19,783
LIABILITIES AND STOCKHOLDERS’ EQUITY
Accounts payable:
Vehicle
$ 79
$ 56
Non-vehicle
578
516
Total accounts payable
657
572
Accrued liabilities
911
863
Accrued taxes, net
170
157
Debt:
Vehicle
10,886
7,921
Non-vehicle
2,977
2,986
Total debt
13,863
10,907
Public Warrants
617
1,324
Operating lease liabilities
1,802
1,510
Self-insured liabilities
472
463
Deferred income taxes, net
1,360
1,010
Total liabilities
19,852
16,806
Commitments and contingencies
Stockholders’ equity:
Preferred stock, $0.01 par value, no shares issued and outstanding
—
—
Common stock, $0.01 par value, 478,914,062 and 477,233,278 shares issued, respectively, and 323,483,178 and 449,782,424 shares outstanding, respectively
5
5
Treasury stock, at cost, 155,430,884 and 27,450,854 common shares, respectively
(3,136)
(708)
Additional paid-in capital
6,326
6,209
Retained earnings (Accumulated deficit)
(256)
(2,315)
Accumulated other comprehensive income (loss)
(294)
(214)
Total stockholders’ equity
2,645
2,977
Total liabilities and stockholders’ equity
$ 22,497
$ 19,783
UNAUDITED CONSOLIDATED STATEMENTS OF CASH FLOWS
Three Months Ended December 31,
Twelve Months Ended December 31,
(In millions)
2022
2021
2022
2021
Cash flows from operating activities:
Net income (loss)
$ 116
$ (261)
$ 2,059
$ 365
Adjustments to reconcile net income (loss) to net cash provided by (used in) operating activities:
Depreciation and reserves for revenue earning vehicles, net
298
94
809
600
Depreciation and amortization, non-vehicle
37
43
142
196
Amortization of deferred financing costs and debt discount (premium)
15
13
53
122
Loss on extinguishment of debt
—
—
—
8
Stock-based compensation charges
34
7
130
10
Provision for receivables allowance
15
30
57
125
Deferred income taxes, net
—
145
301
270
Reorganization items, net
—
—
—
314
(Gain) loss from the sale of a business
—
—
—
(400)
(Gain) loss on sale of non-vehicle capital assets
—
—
(5)
(8)
Change in fair value of Public Warrants
(120)
643
(704)
627
(Gain) loss on financial instruments
9
(3)
(111)
(4)
Other
8
6
11
(1)
Changes in assets and liabilities:
Non-vehicle receivables
(30)
13
(264)
(210)
Prepaid expenses and other assets
(46)
33
(126)
(20)
Operating lease right-of-use assets
78
71
280
274
Non-vehicle accounts payable
50
(25)
43
(70)
Accrued liabilities
(103)
(65)
80
(108)
Accrued taxes, net
21
(65)
73
24
Operating lease liabilities
(86)
(77)
(309)
(291)
Self-insured liabilities
(19)
(4)
19
(17)
Net cash provided by (used in) operating activities
277
598
2,538
1,806
Cash flows from investing activities:
Revenue earning vehicles expenditures
(2,743)
(1,958)
(10,596)
(7,154)
Proceeds from disposal of revenue earning vehicles
2,028
873
6,498
2,818
Non-vehicle capital asset expenditures
(46)
(30)
(150)
(71)
Proceeds from disposal of non-vehicle capital assets
2
(1)
12
16
Collateral payments
—
—
—
(303)
Collateral returned in exchange for letters of credit
—
12
19
280
Return of (investment in) equity investments
(1)
—
(16)
—
Proceeds from the sale of a business, net of cash sold
—
—
—
871
Other
—
—
—
(1)
Net cash provided by (used in) investing activities
(760)
(1,104)
(4,233)
(3,544)
Cash flows from financing activities:
Proceeds from issuance of vehicle debt
1,390
3,861
9,672
14,323
Repayments of vehicle debt
(685)
(3,144)
(6,639)
(12,607)
Proceeds from issuance of non-vehicle debt
—
1,505
—
4,644
Repayments of non-vehicle debt
(6)
(6)
(20)
(6,352)
Payment of financing costs
(6)
(31)
(48)
(185)
Proceeds from Plan Sponsors
—
—
—
2,781
Early redemption premium payment
—
—
—
(85)
Proceeds from exercises of Public Warrants
—
77
3
77
Proceeds from the issuance of preferred stock, net
—
—
—
1,433
Repurchase of preferred stock
—
(1,883)
—
(1,883)
Distributions to common stockholders
—
—
—
(239)
Contributions from (distributions to) noncontrolling interests
—
(13)
—
(38)
Proceeds from 2021 Rights Offering, net
—
—
—
1,639
Share repurchases
(309)
(654)
(2,461)
(654)
Other
(16)
(9)
(20)
(9)
Net cash provided by (used in) financing activities
368
(297)
487
2,845
Effect of foreign currency exchange rate changes on cash and cash equivalents and restricted cash and cash equivalents
25
(12)
(25)
(34)
Net increase (decrease) in cash and cash equivalents and restricted cash and cash equivalents during the period
(90)
(815)
(1,233)
1,073
Cash and cash equivalents and restricted cash and cash equivalents at beginning of period(a)
1,508
3,466
2,651
1,578
Cash and cash equivalents and restricted cash and cash equivalents at end of period
$ 1,418
$ 2,651
$ 1,418
$ 2,651
(a)
Amounts include cash and cash equivalents and restricted cash and cash equivalents of Donlen which were held for sale as of December 31, 2020.
Supplemental Schedule I
HERTZ GLOBAL HOLDINGS, INC.
CONDENSED STATEMENT OF OPERATIONS BY SEGMENT
Unaudited
Three Months Ended December 31, 2022
Three Months Ended December 31, 2021
(In millions)
Americas RAC
International RAC
Corporate
Hertz Global
Americas RAC
International RAC
Corporate
Hertz Global
Revenues
$ 1,707
$ 328
$ —
$ 2,035
$ 1,691
$ 258
$ —
$ 1,949
Expenses:
Direct vehicle and operating
1,098
174
2
1,274
908
154
3
1,065
Depreciation of revenue earning vehicles and lease charges
333
27
—
360
30
48
—
78
Depreciation and amortization of non-vehicle assets
29
3
5
37
36
4
3
43
Selling, general and administrative
81
38
102
221
90
39
59
188
Interest expense, net:
Vehicle
72
10
—
82
31
10
—
41
Non-vehicle
(36)
(1)
83
46
(6)
—
34
28
Total interest expense, net
36
9
83
128
25
10
34
69
Other (income) expense, net
(3)
6
5
8
(2)
1
—
(1)
Change in fair value of Public Warrants
—
—
(120)
(120)
—
—
643
643
Total expenses
1,574
257
77
1,908
1,087
256
742
2,085
Income (loss) before income taxes
$ 133
$ 71
$ (77)
127
$ 604
$ 2
$ (742)
(136)
Income tax (provision) benefit
(11)
(125)
Net income (loss)
116
(261)
Net (income) loss attributable to noncontrolling interests
—
1
Net income (loss) attributable to Hertz Global
116
(260)
Series A Preferred Stock deemed dividends
—
(450)
Net income (loss) available to Hertz Global common stockholders
$ 116
$ (710)
Supplemental Schedule I (continued)
HERTZ GLOBAL HOLDINGS, INC.
CONDENSED STATEMENT OF OPERATIONS BY SEGMENT
Unaudited
Twelve Months Ended December 31, 2022
Twelve Months Ended December 31, 2021
(In millions)
Americas RAC
International RAC
Corporate
Hertz Global
Americas RAC
International RAC
All other operations
Corporate
Hertz Global
Revenues
$ 7,280
$ 1,405
$ —
$ 8,685
$ 6,215
$ 985
$ 136
$ —
$ 7,336
Expenses:
Direct vehicle and operating
4,080
728
—
4,808
3,302
606
5
7
3,920
Depreciation of revenue earning vehicles and lease charges
553
148
—
701
343
154
—
—
497
Depreciation and amortization of non-vehicle assets
114
13
15
142
166
16
2
12
196
Selling, general and administrative
351
180
428
959
282
136
10
260
688
Interest expense, net:
Vehicle
140
19
—
159
213
59
12
—
284
Non-vehicle
(80)
—
249
169
(15)
3
1
196
185
Total interest expense, net
60
19
249
328
198
62
13
196
469
Other (income) expense, net
(6)
3
5
2
(10)
(1)
—
(10)
(21)
Reorganization items, net
—
—
—
—
80
12
(1)
586
677
(Gain) from the sale of a business
—
—
—
—
—
—
—
(400)
(400)
Change in fair value of Public Warrants
—
—
(704)
(704)
—
—
—
627
627
Total expenses
5,152
1,091
(7)
6,236
4,361
985
29
1,278
6,653
Income (loss) before income taxes
$ 2,128
$ 314
$ 7
2,449
$ 1,854
$ —
$ 107
$ (1,278)
683
Income tax (provision) benefit
(390)
(318)
Net income (loss)
2,059
365
Net (income) loss attributable to noncontrolling interests
—
1
Net income (loss) attributable to Hertz Global
2,059
366
Series A Preferred Stock deemed dividends
—
(450)
Net income (loss) available to Hertz Global common stockholders
$ 2,059
$ (84)
NOTE: Effective in the second quarter of 2021, as a result of the sale of the Company’s Donlen fleet management and leasing business on March 30, 2021, the All Other Operations reportable segment, which consisted primarily of the former Donlen business, was no longer deemed a reportable segment.
Supplemental Schedule II
HERTZ GLOBAL HOLDINGS, INC.
RECONCILIATION OF GAAP TO NON-GAAP MEASURE – ADJUSTED NET INCOME (LOSS), ADJUSTED DILUTED EARNINGS (LOSS) PER SHARE AND ADJUSTED CORPORATE EBITDA
Unaudited
Three Months Ended December 31,
Twelve Months Ended December 31,
(In millions, except per share data)
2022
2021
2022
2021
Adjusted Net Income (Loss) and Adjusted Diluted Earnings (Loss) Per Share:
Net income (loss) attributable to Hertz Global
$ 116
$ (260)
$ 2,059
$ 366
Adjustments:
Income tax provision (benefit)
11
125
390
318
Vehicle and non-vehicle debt-related charges(a)(l)
14
13
53
129
Restructuring and restructuring related charges(b)
16
4
45
76
Acquisition accounting-related depreciation and amortization(c)
1
7
3
43
Reorganization items, net(d)
—
—
—
677
Pre-reorganization and non-debtor financing charges(e)
—
—
—
42
Gain from the Donlen Sale(f)
—
—
—
(400)
Change in fair value of Public Warrants
(120)
643
(704)
627
Unrealized (gains) losses on financial instruments
9
(3)
(111)
(4)
Litigation settlements(g)
168
—
168
—
Other items(h)(p)
16
39
105
(29)
Adjusted pre-tax income (loss)(i)
231
568
2,008
1,845
Income tax (provision) benefit on adjusted pre-tax income (loss)(j)
(58)
(142)
(502)
(461)
Adjusted Net Income (Loss)
$ 173
$ 426
$ 1,506
$ 1,384
Weighted-average number of diluted shares outstanding
347
468
403
315
Adjusted Diluted Earnings (Loss) Per Share(k)
$ 0.50
$ 0.91
$ 3.74
$ 4.39
Adjusted Corporate EBITDA:
Net income (loss) attributable to Hertz Global
$ 116
$ (260)
$ 2,059
$ 366
Adjustments:
Income tax provision (benefit)
11
125
390
318
Non-vehicle depreciation and amortization(l)
37
43
142
196
Non-vehicle debt interest, net of interest income(m)
46
28
169
185
Vehicle debt-related charges(a)(n)
10
10
35
72
Restructuring and restructuring related charges(b)
16
4
45
76
Reorganization items, net(d)
—
—
—
677
Pre-reorganization and non-debtor financing charges(e)
—
—
—
42
Gain from the Donlen Sale(f)
—
—
—
(400)
Change in fair value of Public Warrants
(120)
643
(704)
627
Unrealized (gains) losses on financial instruments
9
(3)
(111)
(4)
Litigation settlements(g)
168
—
168
—
Other items(h)(o)
16
38
112
(25)
Adjusted Corporate EBITDA
$ 309
$ 628
$ 2,305
$ 2,130
Supplemental Schedule II (continued)
(a)
Represents debt-related charges relating to the amortization of deferred financing costs and debt discounts and premiums.
(b)
Represents charges incurred under restructuring actions as defined in U.S. GAAP. Also includes restructuring related charges such as incremental costs incurred directly supporting business transformation initiatives. For the year ended December 31, 2021, charges incurred were $36 million, $32 million and $8 million in Corporate, Americas RAC and International RAC, respectively.
(c)
Represents incremental expense associated with the amortization of other intangible assets and depreciation of property and equipment relating to acquisition accounting.
(d)
Represents charges incurred associated with the Reorganization and emergence from Chapter 11, including professional fees. The charges relate primarily to Corporate.
Twelve Months Ended
December 31,
(In millions)
2021
Professional fees and other bankruptcy related costs
$ 257
Loss on extinguishment of debt
191
Backstop fee
164
Breakup fee
77
Contract settlements
25
Cancellation of share-based compensation grants
(10)
Net gain on settlement of liabilities subject to compromise
(22)
Other, net
(5)
Reorganization items, net
$ 677
(e)
Represents charges incurred prior to the filing of the Chapter 11 Cases comprised of preparation charges for the Reorganization, such as professional fees. Also includes, certain non-debtor financing and professional fee charges. For the year ended December 31, 2021, charges incurred were $17 million, $17 million, $6 million and $2 million in Corporate, Americas RAC, International RAC and all other operations, respectively.
(f)
Represents the gain from the sale of the Company’s Donlen business on March 30, 2021, primarily associated with Corporate.
(g)
Represents payments made for the settlement of certain claims related to alleged false arrests in our Americas RAC segment.
(h)
Represents miscellaneous items. For 2022, includes certain bankruptcy claims and certain professional fees and charges related to the settlement of bankruptcy claims. For 2021, includes $100 million associated with the suspension of depreciation during the first quarter for the Donlen business while classified as held for sale in all other operations, partially offset by $17 million for certain professional fees primarily associated with Corporate, $14 million of charges related to the settlement of bankruptcy claims primarily associated with Corporate, charges for a multiemployer pension plan withdrawal liability recorded in Corporate, letter of credit fees recorded primarily in Corporate, and $12 million of costs associated with the Company’s information technology and finance transformation programs, both of which were multi-year initiatives to upgrade and modernize the Company’s systems and processes primarily in Corporate.
Supplemental Schedule II (continued)
(i)
Adjustments by caption on a pre-tax basis were as follows:
Increase (decrease) to expenses
Three Months Ended
December 31,
Twelve Months Ended
December 31,
(In millions)
2022
2021
2022
2021
Direct vehicle and operating
$ (178)
$ (12)
$ (232)
$ 33
Selling, general and administrative
(17)
2
(79)
(90)
Interest expense, net:
Vehicle
(16)
(10)
76
(91)
Non-vehicle
(8)
(3)
(28)
(57)
Total interest expense, net
(24)
(13)
58
(148)
Intangible and other asset impairments
—
—
—
—
Other income (expense), net
(5)
(37)
—
(52)
Reorganization items, net
—
—
—
(677)
Gain from the Donlen Sale
—
—
—
400
Change in fair value of Public Warrants
120
(643)
704
(627)
Total adjustments
$ (104)
$ (703)
$ 441
$ (1,161)
(j)
Derived utilizing a combined statutory rate of 25% for the periods ended December 31, 2022 and 2021, respectively, applied to the respective Adjusted Pre-tax Income (Loss).
(k)
Adjustments used to reconcile diluted earnings (loss) per share on a GAAP basis to Adjusted Diluted Earnings (Loss) Per Share are comprised of the same adjustments, inclusive of the tax impact, used to reconcile net income (loss) to Adjusted Net Income (Loss) divided by the weighted-average diluted shares outstanding during the period.
(l)
Non-vehicle depreciation and amortization expense for Americas RAC, International RAC and Corporate for the three months ended December 31, 2022 was $29 million, $3 million and $5 million, respectively. For the three months ended December 31, 2021 was $36 million, $4 million, and $3 million, respectively. Non-vehicle depreciation and amortization for Americas RAC, International RAC, and Corporate for the twelve months ended December 31, 2022 were $114 million, $13 million, and $15 million, respectively. For the twelve months ended December 31, 2021 were $166 million, $16 million, $2 million and $12 million, for Americas RAC, International RAC, all other operations, and Corporate, respectively.
(m)
In 2021, includes $8 million of loss on extinguishment of debt associated with the payoff and termination of non-vehicle debt in Corporate in the second quarter of 2021.
(n)
Vehicle debt-related charges for Americas RAC and International RAC for the three months ended December 31, 2022 were $8 million and $2 million, respectively. For the three months ended December 31, 2021 vehicle debt-related charges for Americas RAC and International RAC were $6 million and $4 million, respectively. Vehicle debt-related charges for Americas RAC and International RAC for the twelve months ended December 31, 2022 were $25 million and $10 million, respectively. For the twelve months ended December 31, 2021 were $53 million, $16 million and $2 million for Americas RAC, International RAC and all other operations, respectively.
(o)
Also includes an adjustment for certain non-cash stock-based compensation charges in Corporate.
(p)
Also includes letter of credit fees recorded in 2022 and the second half of 2021 in Corporate.
Supplemental Schedule III
HERTZ GLOBAL HOLDINGS, INC.
RECONCILIATION OF GAAP TO NON-GAAP MEASURE – ADJUSTED OPERATING CASH FLOW
AND ADJUSTED FREE CASH FLOW
Unaudited
Three Months Ended
December 31,
Twelve Months Ended
December 31,
(In millions)
2022
2021
2022
2021
ADJUSTED OPERATING CASH FLOW AND ADJUSTED FREE CASH FLOW:
Net cash provided by (used in) operating activities
$ 277
$ 598
$ 2,538
$ 1,806
Depreciation and reserves for revenue earning vehicles
(298)
(94)
(809)
(600)
Bankruptcy related payments (post emergence) and other payments(a)
177
69
261
257
Adjusted operating cash flow
156
573
1,990
1,463
Non-vehicle capital asset expenditures, net
(44)
(31)
(138)
(55)
Adjusted operating cash flow before vehicle investment
112
542
1,852
1,408
Net fleet growth after financing
312
(32)
(360)
(1,980)
Noncontrolling interests
—
(1)
—
(26)
Adjusted free cash flow
$ 424
$ 509
$ 1,492
$ (598)
CALCULATION OF NET FLEET GROWTH AFTER FINANCING:
Revenue earning vehicles expenditures
$ (2,743)
$ (1,958)
$ (10,596)
$ (7,154)
Proceeds from disposal of revenue earning vehicles
2,028
873
6,498
2,818
Revenue earning vehicles capital expenditures, net
(715)
(1,085)
(4,098)
(4,336)
Depreciation and reserves for revenue earning vehicles
298
94
809
600
Financing activity related to vehicles:
Borrowings
1,390
3,861
9,672
14,323
Payments
(685)
(3,144)
(6,639)
(12,607)
Restricted cash changes, vehicle(b)
24
242
(104)
40
Net financing activity related to vehicles
729
959
2,929
1,756
Net fleet growth after financing
$ 312
$ (32)
$ (360)
$ (1,980)
(a)
Also includes payments made for the settlement of certain claims related to alleged false arrests in our Americas RAC segment.
(b)
The twelve months ended December 31, 2021 includes a $68 million impact related to restricted cash classified as held for sale as of December 31, 2020.
Supplemental Schedule IV
HERTZ GLOBAL HOLDINGS, INC.
NET DEBT CALCULATION
Unaudited
(In millions)
As of December 31, 2022
As of December 31, 2021
Vehicle
Non-Vehicle
Total
Vehicle
Non-Vehicle
Total
Term loans
$ —
$ 1,526
$ 1,526
$ —
$ 1,539
$ 1,539
Senior notes
—
1,500
1,500
—
1,500
1,500
U.S. vehicle financing (HVF III)
9,406
—
9,406
7,001
—
7,001
International vehicle financing (Various)
1,466
—
1,466
860
—
860
Other debt
76
9
85
93
16
109
Debt issue costs, discounts and premiums
(62)
(58)
(120)
(33)
(69)
(102)
Debt as reported in the balance sheet
10,886
2,977
13,863
7,921
2,986
10,907
Add:
Debt issue costs, discounts and premiums
62
58
120
33
69
102
Less:
Cash and cash equivalents
—
943
943
—
2,258
2,258
Restricted cash
180
—
180
77
—
77
Restricted cash and restricted cash equivalents associated with Term C Loan
—
245
245
—
245
245
Net Debt
$ 10,768
$ 1,847
$ 12,615
$ 7,877
$ 552
$ 8,429
Corporate leverage ratio(a)
0.8x
0.3x
(a)
Corporate leverage ratio is calculated as non-vehicle net debt divided by Adjusted Corporate EBITDA.
Supplemental Schedule V
HERTZ GLOBAL HOLDINGS, INC.
KEY METRICS CALCULATIONS
REVENUE, UTILIZATION AND DEPRECIATION
Unaudited
Global RAC
Three Months Ended
December 31,
Percent Inc/(Dec)
Twelve Months Ended December 31,
Percent Inc/(Dec)
($ in millions, except where noted)
2022
2021
2022
2021
Total RPD
Revenues
$ 2,035
$ 1,949
$ 8,685
$ 7,200
Foreign currency adjustment(a)
41
(3)
111
(36)
Total Revenues – adjusted for foreign currency
$ 2,076
$ 1,946
$ 8,796
$ 7,164
Transaction Days (in thousands)
33,673
32,551
136,860
120,573
Total RPD (in dollars)(c)
$ 61.65
$ 59.80
3 %
$ 64.27
$ 59.41
8 %
Total Revenue Per Unit Per Month
Total Revenues – adjusted for foreign currency
$ 2,076
$ 1,946
$ 8,796
$ 7,164
Average Rentable Vehicles (in whole units)(d)
465,943
454,000
478,798
421,497
Total revenue per unit (in whole dollars)
$ 4,456
$ 4,287
$ 18,371
$ 16,996
Number of months in period (in whole units)
3
3
12
12
Total RPU Per Month (in whole dollars)(c)(d)
$ 1,485
$ 1,429
4 %
$ 1,531
$ 1,416
8 %
Vehicle Utilization
Transaction Days (in thousands)
33,673
32,551
136,860
120,573
Average Rentable Vehicles (in whole units)(d)
465,943
454,000
478,798
421,497
Number of days in period (in whole units)
92
92
365
365
Available Car Days (in thousands)
42,870
41,770
174,826
153,996
Vehicle Utilization(b)(d)
79 %
78 %
78 %
78 %
Depreciation Per Unit Per Month
Depreciation of revenue earning vehicles and lease charges, net
$ 360
$ 78
$ 701
$ 497
Foreign currency adjustment(a)
3
—
12
(5)
Adjusted depreciation of revenue earning vehicles and lease charges
$ 363
$ 78
$ 713
$ 492
Average Vehicles (in whole units)
496,926
470,900
506,046
433,290
Adjusted depreciation of revenue earning vehicles and lease charges divided by Average Vehicles (in whole dollars)
$ 731
$ 167
$ 1,409
$ 1,136
Number of months in period (in whole units)
3
3
12
12
Depreciation Per Unit Per Month (in whole dollars)
$ 244
$ 55
NM
$ 117
$ 95
24 %
Note: Global RAC represents Americas RAC and International RAC segment information on a combined basis and excludes Corporate and the Company’s former Donlen leasing operations which were sold on March 30, 2021.
(a)
Based on December 31, 2021 foreign exchange rates.
(b)
Calculated as Transaction Days divided by Available Car Days.
(c)
Effective during the third quarter of 2021, the Company revised its calculation of Total RPD and Total RPU to include ancillary retail vehicle sales revenues.
(d)
Effective in the first quarter of 2022, the Company revised its calculation of Total RPU and Vehicle Utilization to use Average Rentable Vehicles in the denominator which excludes vehicles for sale on the Company’s retail lots or actively in the process of being sold through other disposition channels.
Supplemental Schedule V (continued)
HERTZ GLOBAL HOLDINGS, INC.
KEY METRICS CALCULATIONS
REVENUE, UTILIZATION AND DEPRECIATION
Unaudited
Americas RAC
Three Months Ended
December 31,
Percent Inc/(Dec)
Twelve Months Ended December 31,
Percent Inc/(Dec)
($ in millions, except where noted)
2022
2021
2022
2021
Total RPD
Revenues
$ 1,707
$ 1,691
$ 7,280
$ 6,215
Foreign currency adjustment(a)
3
(1)
4
(3)
Total Revenues – adjusted for foreign currency
$ 1,710
$ 1,690
$ 7,284
$ 6,212
Transaction Days (in thousands)
27,367
27,215
111,759
100,085
Total RPD (in dollars)(c)
$ 62.50
$ 62.11
1 %
$ 65.18
$ 62.07
5 %
Total Revenue Per Unit Per Month
Total Revenues – adjusted for foreign currency
$ 1,710
$ 1,690
$ 7,284
$ 6,212
Average Rentable Vehicles (in whole units)(d)
370,723
368,434
385,234
345,306
Total revenue per unit (in whole dollars)
$ 4,614
$ 4,588
$ 18,909
$ 17,991
Number of months in period (in whole units)
3
3
12
12
Total RPU Per Month (in whole dollars)(c)(d)
$ 1,538
$ 1,529
1 %
$ 1,576
$ 1,499
5 %
Vehicle Utilization
Transaction Days (in thousands)
27,367
27,215
111,759
100,085
Average Rentable Vehicles (in whole units)
370,723
368,434
385,234
345,306
Number of days in period (in whole units)
92
92
365
365
Available Car Days (in thousands)
34,109
33,898
140,647
126,159
Vehicle Utilization(b)
80 %
80 %
79 %
79 %
Depreciation Per Unit Per Month
Depreciation of revenue earning vehicles and lease charges, net
$ 333
$ 30
$ 553
$ 343
Foreign currency adjustment(a)
—
—
1
—
Adjusted depreciation of revenue earning vehicles and lease charges
$ 333
$ 30
$ 554
$ 343
Average Vehicles (in whole units)
398,860
384,492
411,047
355,647
Adjusted depreciation of revenue earning vehicles and lease charges divided by Average Vehicles (in whole dollars)
$ 834
$ 77
$ 1,348
$ 964
Number of months in period (in whole units)
3
3
12
12
Depreciation Per Unit Per Month (in whole dollars)
$ 278
$ 26
NM
$ 112
$ 81
39 %
NM – Not meaningful
(a)
Based on December 31, 2021 foreign exchange rates.
(b)
Calculated as Transaction Days divided by Available Car Days.
(c)
Effective during the third quarter of 2021, the Company revised its calculation of Total RPD and Total RPU to include ancillary retail vehicle sales revenues.
(d)
Effective in the first quarter of 2022, the Company revised its calculation of Total RPU and Vehicle Utilization to use Average Rentable Vehicles in the denominator which excludes vehicles for sale on the Company’s retail lots or actively in the process of being sold through other disposition channels.
Supplemental Schedule V (continued)
HERTZ GLOBAL HOLDINGS, INC.
KEY METRICS CALCULATIONS
REVENUE, UTILIZATION AND DEPRECIATION
Unaudited
International RAC
Three Months Ended December 31,
Percent Inc/(Dec)
Twelve Months Ended December 31,
Percent Inc/(Dec)
($ in millions, except where noted)
2022
2021
2022
2021
Total RPD
Revenues
$ 328
$ 258
$ 1,405
$ 985
Foreign currency adjustment(a)
38
(2)
107
(34)
Total Revenues – adjusted for foreign currency
$ 366
$ 256
$ 1,512
$ 951
Transaction Days (in thousands)
6,305
5,335
25,101
20,488
Total RPD (in dollars)(c)
$ 57.98
$ 48.01
21 %
$ 60.23
$ 46.43
30 %
Total Revenue Per Unit Per Month
Total Revenues – adjusted for foreign currency
$ 366
$ 256
$ 1,512
$ 951
Average Rentable Vehicles (in whole units)(d)
95,221
85,565
93,564
76,190
Total revenue per unit (in whole dollars)
$ 3,840
$ 2,994
$ 16,158
$ 12,485
Number of months in period (in whole units)
3
3
12
12
Total RPU Per Month (in whole dollars)(c)(d)
$ 1,280
$ 998
28 %
$ 1,346
$ 1,040
29 %
Vehicle Utilization
Transaction Days (in thousands)
6,305
5,335
25,101
20,488
Average Rentable Vehicles (in whole units)
95,221
85,565
93,564
76,190
Number of days in period (in whole units)
92
92
365
365
Available Car Days (in thousands)
8,762
7,872
34,179
27,837
Vehicle Utilization(b)
72 %
68 %
73 %
74 %
Depreciation Per Unit Per Month
Depreciation of revenue earning vehicles and lease charges
$ 27
$ 48
$ 148
$ 154
Foreign currency adjustment(a)
3
—
11
(5)
Adjusted depreciation of revenue earning vehicles and lease charges
$ 30
$ 48
$ 159
$ 149
Average Vehicles (in whole units)
98,065
86,408
94,999
77,643
Adjusted depreciation of revenue earning vehicles and lease charges divided by Average Vehicles (in whole dollars)
$ 301
$ 552
$ 1,673
$ 1,915
Number of months in period (in whole units)
3
3
12
12
Depreciation Per Unit Per Month (in whole dollars)
$ 104
$ 184
(44) %
$ 139
$ 160
(13) %
(a)
Based on December 31, 2021 foreign exchange rates.
(b)
Calculated as Transaction Days divided by Available Car Days.
(c)
Effective during the third quarter of 2021, the Company revised its calculation of Total RPD and Total RPU to include ancillary retail vehicle sales revenues.
(d)
Effective in the first quarter of 2022, the Company revised its calculation of Total RPU and Vehicle Utilization to use Average Rentable Vehicles in the denominator which excludes vehicles for sale on the Company’s retail lots or actively in the process of being sold through other disposition channels.
NON-GAAP MEASURES AND KEY METRICS
The term "GAAP" refers to accounting principles generally accepted in the United States. Adjusted EBITDA is the Company’s segment measure of profitability and complies with GAAP when used in that context.
NON-GAAP MEASURES
Non-GAAP measures are not recognized measurements under GAAP. When evaluating the Company’s operating performance or liquidity, investors should not consider non-GAAP measures in isolation of, superior to, or as a substitute for measures of the Company’s financial performance as determined in accordance with GAAP.
Adjusted Net Income (Loss) and Adjusted Diluted Earnings (Loss) Per Share ("Adjusted EPS")
Adjusted Net Income (Loss) represents income or loss attributable to the Company as adjusted to eliminate the impact of GAAP income tax; vehicle and non-vehicle debt-related charges; restructuring and restructuring related charges; acquisition accounting-related depreciation and amortization; reorganization items, net; pre-reorganization and non-debtor financing charges; gain from the sale of a business; change in fair value of Public Warrants; unrealized (gains) losses on financial instruments and certain other miscellaneous items on a pre-tax basis. Adjusted Net Income (Loss) includes a provision (benefit) for income taxes derived utilizing a combined statutory rate. The combined statutory rate is management’s estimate of the Company’s long-term tax rate. Its most comparable GAAP measure is net income (loss) attributable to the Company.
Adjusted EPS represents Adjusted Net Income (Loss) on a per diluted share basis using the weighted-average number of diluted shares outstanding for the period. Its most comparable GAAP measure is diluted earnings (loss) per share.
Adjusted Net Income (Loss) and Adjusted EPS are important operating metrics because they allow management and investors to assess operational performance of the Company’s business, exclusive of the items mentioned above that are not operational in nature or comparable to those of the Company’s competitors.
Adjusted Corporate EBITDA and Adjusted Corporate EBITDA Margin
Adjusted Corporate EBITDA represents income or loss attributable to the Company as adjusted to eliminate the impact of GAAP income tax; non-vehicle depreciation and amortization; non-vehicle debt interest, net; vehicle debt-related charges; restructuring and restructuring related charges; reorganization items, net; pre-reorganization and non-debtor financing charges; gain from the sale of a business; change in fair value of Public Warrants; unrealized (gains) losses on financial instruments and certain other miscellaneous items.
Adjusted Corporate EBITDA Margin is calculated as the ratio of Adjusted Corporate EBITDA to total revenues.
Management uses these measures as operating performance metrics for internal monitoring and planning purposes, including the preparation of the Company’s annual operating budget and monthly operating reviews, and analysis of investment decisions, profitability and performance trends. These measures enable management and investors to isolate the effects on profitability of operating metrics most meaningful to the business of renting and leasing vehicles. They also allow management and investors to assess the performance of the entire business on the same basis as its reportable segments. Adjusted Corporate EBITDA is also utilized in the determination of certain executive compensation. Its most comparable GAAP measure is net income (loss) attributable to the Company.
Adjusted operating cash flow and adjusted free cash flow
Adjusted operating cash flow represents net cash provided by operating activities net of the non-cash add back for vehicle depreciation and reserves, and exclusive of bankruptcy related payments made post emergence. Adjusted operating cash flow is important to management and investors as it provides useful information about the amount of cash generated from operations when fully burdened by fleet costs.
Adjusted free cash flow represents adjusted operating cash flow plus the impact of net non-vehicle capital expenditures and net fleet growth after financing. Adjusted free cash flow is important to management and investors as it provides useful information about the amount of cash available for, but not limited to, the reduction of non-vehicle debt, share repurchase and acquisition.
KEY METRICS
Available Car Days
Available Car Days represents Average Rentable Vehicles multiplied by the number of days in a given period.
Average Vehicles ("Fleet Capacity" or "Capacity")
Average Vehicles is determined using a simple average of the number of vehicles in the fleet whether owned or leased by the Company at the beginning and end of a given period.
Average Rentable Vehicles
Average Rentable Vehicles reflects Average Vehicles excluding vehicles for sale on the Company’s retail lots or actively in the process of being sold through other disposition channels.
Depreciation Per Unit Per Month ("Depreciation Per Unit" or "DPU")
Depreciation Per Unit Per Month represents the amount of average depreciation expense and lease charges per vehicle per month, exclusive of the impacts of foreign currency exchange rates so as not to affect the comparability of underlying trends. This metric is important to management and investors as it reflects how effectively the Company is managing the costs of its vehicles and facilitates comparisons with other participants in the vehicle rental industry.
Total Revenue Per Transaction Day ("Total RPD"or "RPD"; also referred to as "pricing")
Total RPD represents revenue generated per transaction day, excluding the impact of foreign currency exchange rates so as not to affect the comparability of underlying trends. This metric is important to management and investors as it represents a measure of changes in the underlying pricing in the vehicle rental business and encompasses the elements in vehicle rental pricing that management has the ability to control.
Historically, the Company excluded revenue generated from ancillary retail vehicles sales. Effective in the third quarter 2021, the Company revised its calculation of Total RPD to include ancillary retail vehicle sales revenues to better align with current industry practice. Prior periods shown have been restated to conform with the revised definition.
Total Revenue Per Unit Per Month ("Total RPU" or "Total RPU Per Month")
Total RPU Per Month represents the amount of revenue generated per vehicle in the rental fleet each month, excluding the impact of foreign currency exchange rates so as not to affect the comparability of underlying trends. This metric is important to management and investors as it provides a measure of revenue productivity relative to the number of vehicles in our rental fleet whether owned or leased, or asset efficiency.
Historically, the Company excluded revenue generated from ancillary retail vehicles sales. Effective in the third quarter 2021, the Company revised its calculation of Total RPU to include ancillary retail vehicle sales revenues to better align with current industry practice. Also, historically, the company used Average Vehicles as the denominator to calculate Total RPU and effective in the first quarter of 2022, the Company revised the calculation to use Average Rentable Vehicles. Prior periods shown have been restated to conform with the revised definition.
Transaction Days ("Days"; also referred to as "volume")
Transaction Days represents the total number of 24-hour periods, with any partial period counted as one Transaction Day, that vehicles were on rent (the period between when a rental contract is opened and closed) in a given period. Thus, it is possible for a vehicle to attain more than one Transaction Day in a 24-hour period. This metric is important to management and investors as it represents the number of revenue-generating days.
Vehicle Utilization ("Utilization")
Effective in the first quarter of 2022, in connection with the appointment of the new CEO (who serves as our Chief Operating Decision Maker) and arising from significantly increased activity in vehicle dispositions, we began using Average Rentable Vehicles when calculating Available Car Days, Total RPU and Utilization instead of Average Vehicles. Average Rentable Vehicles excludes vehicles for sale on the Company’s retail lots or actively in the process of being sold through other disposition channels. We believe this is a better measure of the productivity of our rental fleet as it is unaffected by fluctuations in disposition activity. Prior periods have been restated to conform with the revisions, as appropriate.
The two marquee brands celebrate 45 years of partnership and look toward the future with new five-year agreement
ESTERO, Fla. and ORLANDO, Fla., Jan. 25, 2023 /PRNewswire/ — Hertz, one of the most recognized vehicle rental companies around the globe, and AAA, one of North America’s largest and most trusted membership organizations serving over 56 million U.S. members, have extended their exclusive, 45-year relationship with the signing of a new five-year agreement.
The relationship, which commenced in 1978 and is one of Hertz and AAA’s most longstanding, provides AAA members with a comprehensive suite of car rental benefits, discounted rates, and other exclusive perks which include:
AAA President and CEO Marshall Doney with Hertz CEO Stephen Scherr.
Everyday savings off the base rate rental
No charge for additional drivers who are also AAA members
Free use of one child, infant or booster seat
Young renter fee waived for members ages 20-24
Access to Hertz Gold Plus Rewards® loyalty program, which offers additional and exclusive benefits
Hertz and AAA will continue to elevate this partnership over the next five years by creating opportunities to align on strategic initiatives, developing contemporary services and technologies, and identifying new ways to exceed member satisfaction.
"We are proud to continue our longstanding partnership with AAA, providing members with an unparalleled suite of benefits and savings when renting from Hertz," said Stephen Scherr, Hertz CEO. "It’s thrilling for two pioneering brands, both in travel and automotive, to continue our mutual commitment to delivering superior service."
In addition to the already robust benefits offered to members, AAA is also aligned with Hertz’s commitment to electric vehicles (EVs); particularly its investment to create one of the largest EV rental fleets in the world. EVs are a top priority for AAA as it continues to expand its body of related research to understand consumer opinion, vehicle functionality, and other areas of interest. As the popularity of electric vehicles grows, AAA believes working with Hertz is another step toward expanding consumer adoption for EVs.
"Hertz is one of AAA’s only exclusive relationships, and there’s a reason for that," said Marshall Doney, president, and CEO, AAA. "They consistently deliver exceptional value to our members while keeping an eye on consumer trends and evolving their offerings to match those needs."
About Hertz The Hertz Corporation, a subsidiary of Hertz Global Holdings, Inc., operates the Hertz, Dollar and Thrifty vehicle rental brands throughout North America, Europe, the Caribbean, Latin America, Africa, the Middle East, Asia, Australia and New Zealand. The Hertz Corporation is one of the largest worldwide vehicle rental companies, and the Hertz brand is one of the most recognized globally. Additionally, The Hertz Corporation operates the Firefly vehicle rental brand and Hertz 24/7 car sharing business in international markets and sells vehicles through Hertz Car Sales. For more information about The Hertz Corporation, visit www.hertz.com.
About AAA
Started in 1902 by automotive enthusiasts who wanted to chart a path for better roads in America and advocate for safe mobility, AAA has transformed into one of North America’s largest membership organizations. Today, AAA provides roadside assistance, travel, discounts, financial and insurance services to enhance the life journey of 62 million members across North America, including 56 million in the United States. To learn more about all AAA has to offer or to become a member, visit AAA.com